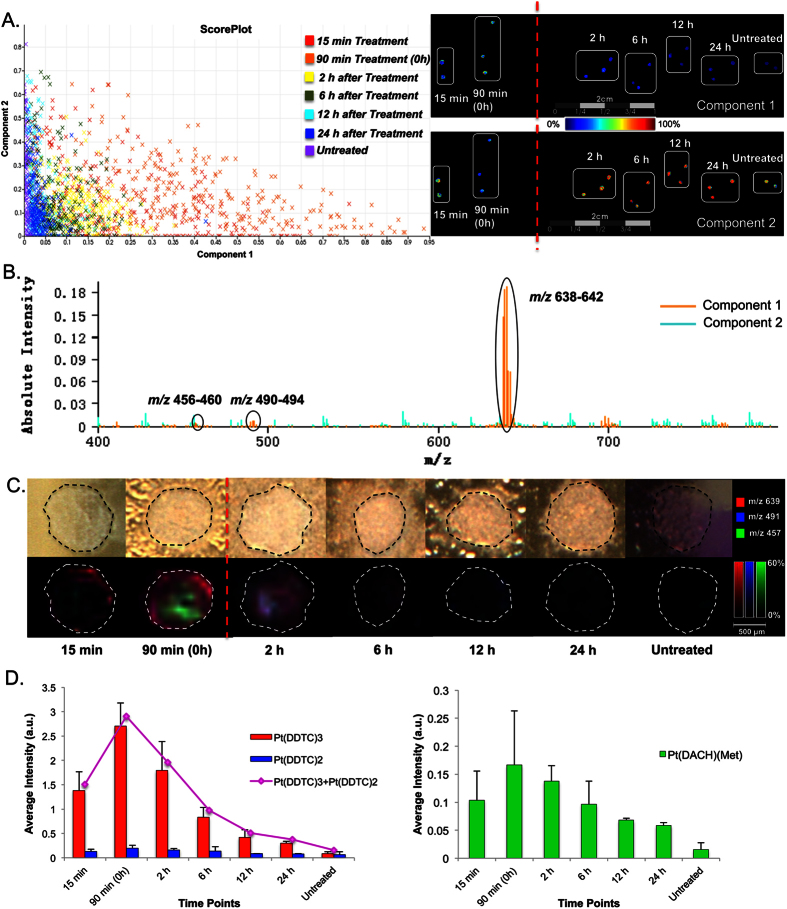
Figure 4. HIPEC treatment of colorectal cancer MCTS with oxaliplatin.
(A) Probabilistic Latent Semantic Analysis (pLSA) of MCTS (with DDTC derivatization). The MCTS were treated for 15 or 90 min. Drug clearance was evaluated at 2, 6, 12, and 24 h post 90 min treatment. pLSA was able to separate spectra from oxaliplatin treated and untreated MCTS in the first component as shown in the Score Plot. The score images show that Component 1 and Component 2 depict completely different distribution patterns in the dataset. (B) Loading plots illustrate the Pt(DDTC)2, Pt(DDTC)3 signals (m/z 491 and 639) and the Pt(DACH)(Met) metabolite, also known as the monomethionine metabolite (m/z 457), are in the first component. (C) MALDI IMS images of HIPEC treated MCTS and the relative distribution of Pt species. (D) Average signal intensities of Pt species from MALDI IMS results.

