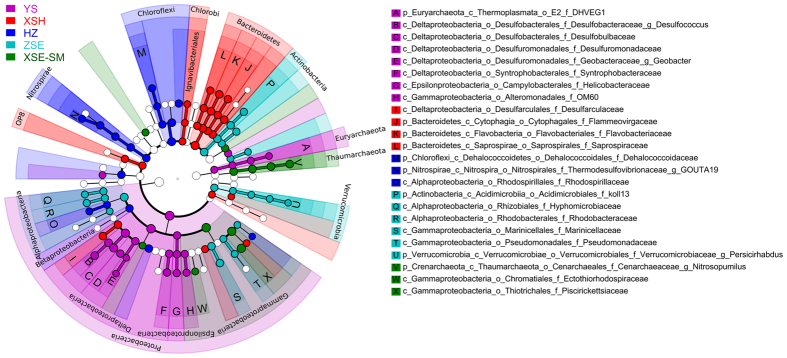
Figure 2. Taxonomic cladogram comparing all samples categorized in the five coastal zones by least discriminant analysis (LDA) effect size.
Samples from XSE and SM are tested as the same group according to the non-significant pattern between their compositions as indicated in Fig. 1 and Table 1. Significantly discriminant taxon nodes are colored, and the branch areas are shaded according to the highest ranked group for that taxon. When the taxon was not significantly differentially represented among the sample groups, the corresponding node was colored white. Highly abundant and selected taxa are indicated. For the complete list of discriminant taxa and ranks used to generate this cladogram see Dataset S3. Refer to Fig. 1 for coastal zone abbreviations.

