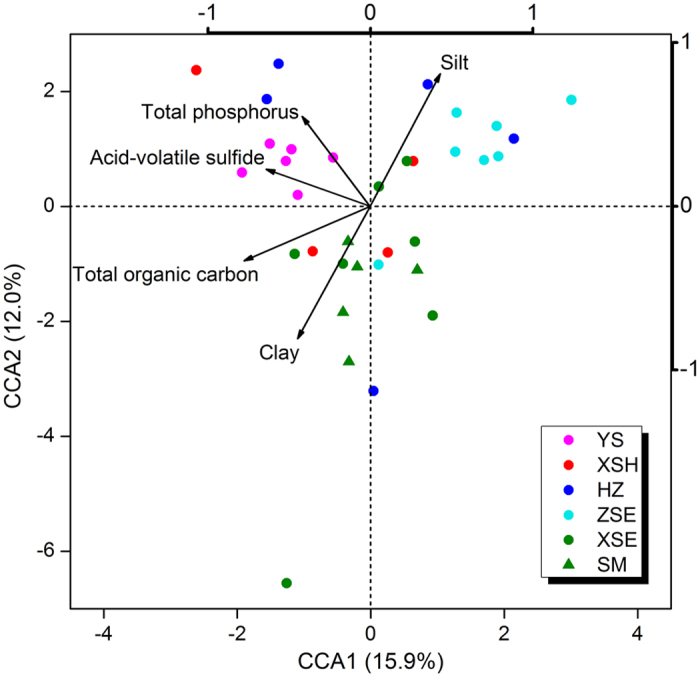
Figure 4. Canonical Correspondence Analysis (CCA) of sediment predicted gene ontologies across sampling stations.

PICRUSt predicted function data are based on KOs with only genes classified as “Metabolism” included.

PICRUSt predicted function data are based on KOs with only genes classified as “Metabolism” included.