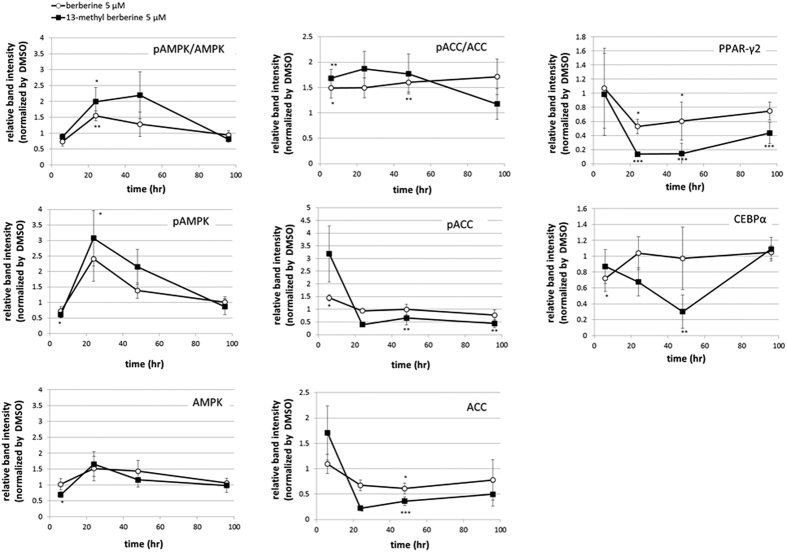
Figure 3. Immunoblot analyses showing effects of berberine- or 13-methylberberine-treated adipocytes on pAMPK/AMPK, pAMPK, AMPK, pACC/ACC, pACC, ACC, PPARγ2, and C/EBPα protein levels after 6, 24, 48 and 96 h.
Values were normalized to control (DMSO). Band intensities were quantified using ImageJ. n = 6, error bar = SE. p < 0.05, **p < 0.01, ***p < 0.001 two-tailed Student’s t-test. (Immunoblot images can be found in Supplementary Fig. S5).

