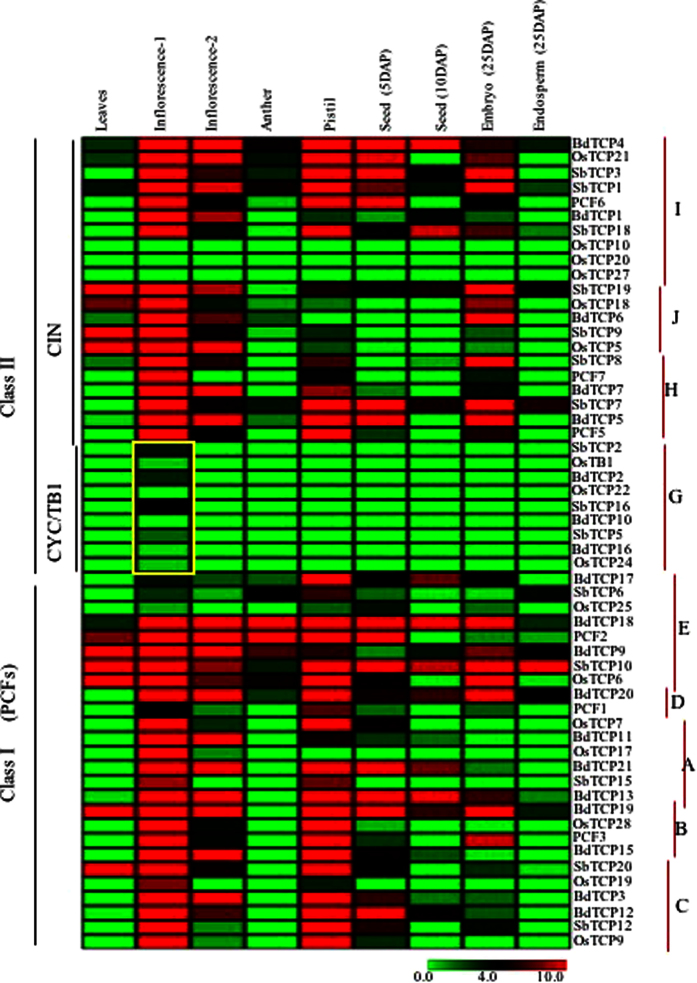
Figure 7. Comparative expression analysis of TCP genes in rice, Brachypodium and Sorghum.
Heat map was generated based on FPKM values obtained from the previously published transcriptomic data20. The scale bar at the base represents relative expression values.

