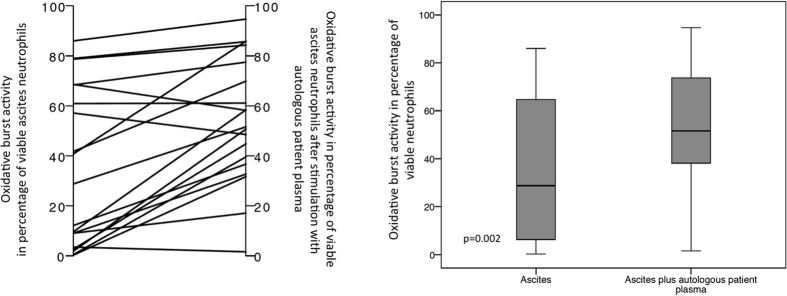
Figure 5. Oxidative burst rate of ascites’ neutrophils after incubation with autologous plasma.
The left plot portrays the individual changes, while the boxplots present the distribution of oxidative burst rates of ascites’ neutrophils before and after incubation with autologous patients’ plasma. Values are given as the percentage of viable neutrophils.

