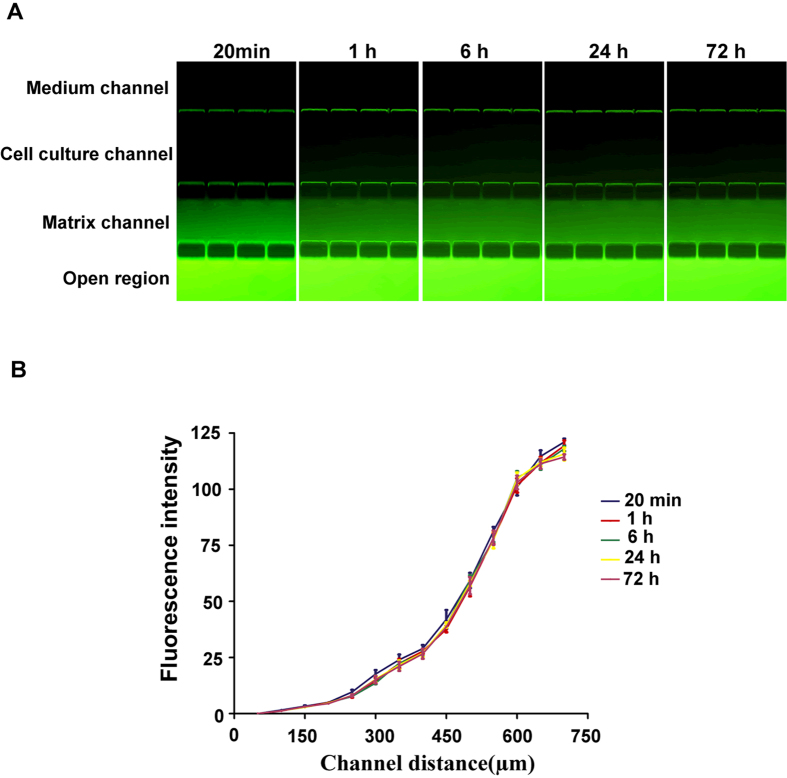
Figure 2. Analysis of concentration gradient generation and maintenance in the channels.
The fluorescent dye FITC was used to form a concentration gradient across the channels by pumping PBS without FITC into the medium channel at 3 μL/h and supplying the PBS containing FITC into the open region by a Petri dish. (A) Fluorescence gradient images after perfusion of FITC for 20 min, 1 h, 6 h, 24 h and 72 h. (B) A quantitative profile of fluorescence intensity across the channels at these time points (original magnification ×200).

