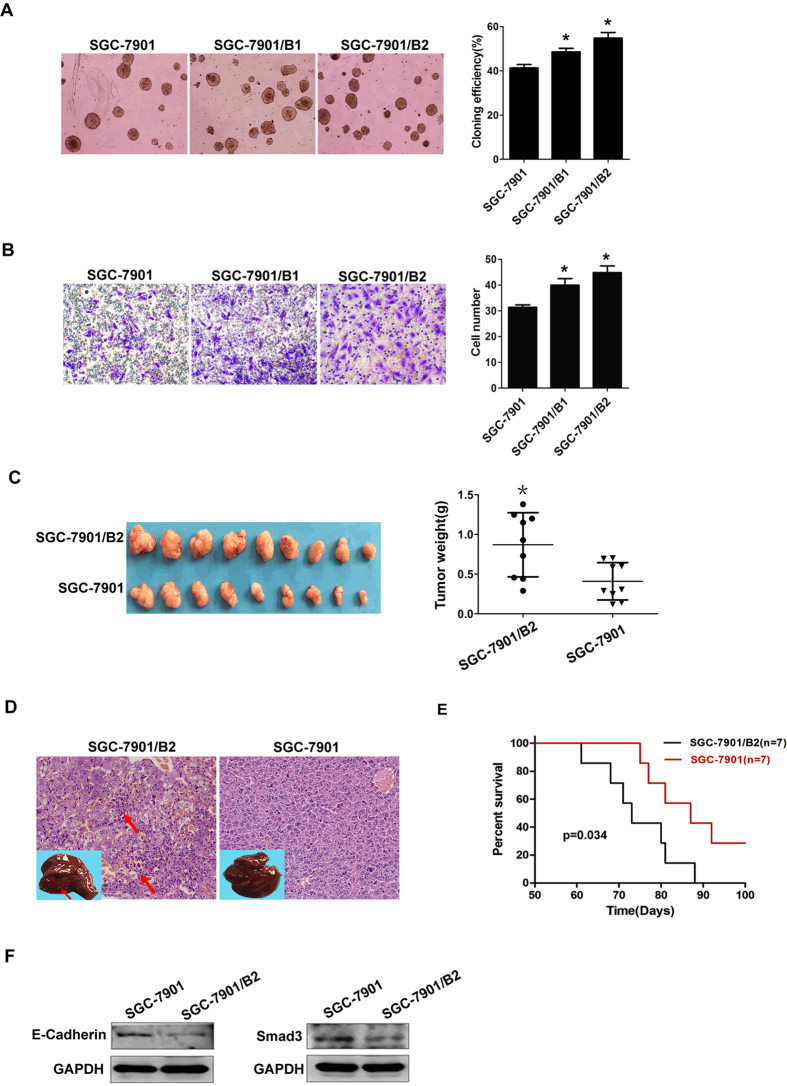
Figure 6. In vitro and in vivo characteristics of the subline cells.
(A) Colony formation assay. Parental SGC-7901, SGC-7901/B1 and subline SGC-7901/B2 cells were suspended in soft agar and cultured for two weeks. Colonies were imaged by phase-contrast microscopy (left), and those containing more than 50 cells were quantitatively assessed (right). Each independent experiment was repeated three times. (B) Transwell invasion assay. Parental SGC-7901, SGC-7901/B1 and subline SGC-7901/B2 cells were seeded on the upper chamber. The invading cells were stained by Trypan Blue (left) and counted for quantitative analysis (right). Each independent experiment was repeated three times. (C) Parental or subline cells (2 × 10⁶) were subcutaneously injected into nude mice. The locally formed tumors were measured by size and weight. (D) Representative image of H&E-stained liver sections of mice, and the metastatic nests of gastric cancer subline cells are indicated by arrows. The insets showed liver tissues with metastatic foci indicated by arrows. (E) A Kaplan-Meier plot comparing survival durations in mice injected with parental cells and subline cells (1 × 10⁶) (original magnification ×200, *p ≤ 0.05 compared with parental cells). (F) Protein expression analysis. Total proteins were extracted from parental and subline cells, respectively and subjected to Western blotting for E-Cadherin and Smad3 protein expression analysis. GAPDH was used as the control protein.

