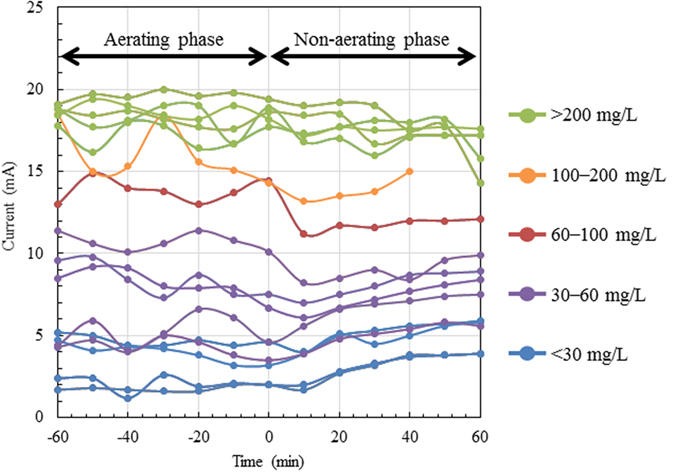
Figure 4. Profiles of current generation by the iBOB biosensor at various BOD5 concentrations in the intermittently aerated tank.

The zero value on the horizontal axis indicates the time point of switching from the aerating to the non-aerating phase. BOD5 concentrations are indicated by colour.
