
Figure 6. Potential of mean force (PMF) profiles for NEU1/TM2 in POPC bilayer generated using MD simulations with umbrella sampling.
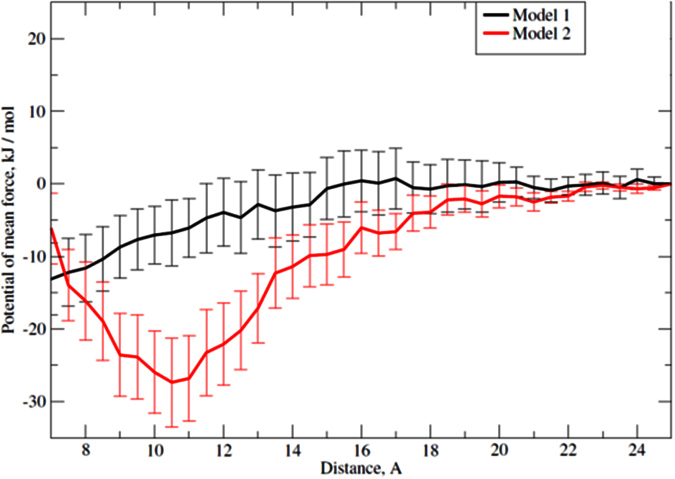
Energy profiles for the homodimer of NEU1/TM2, models 1 and 2 are shown in black and red, respectively. Distance between centers of mass of the peptides is taken as a reaction coordinate. Statistical errors are indicated with vertical lines.