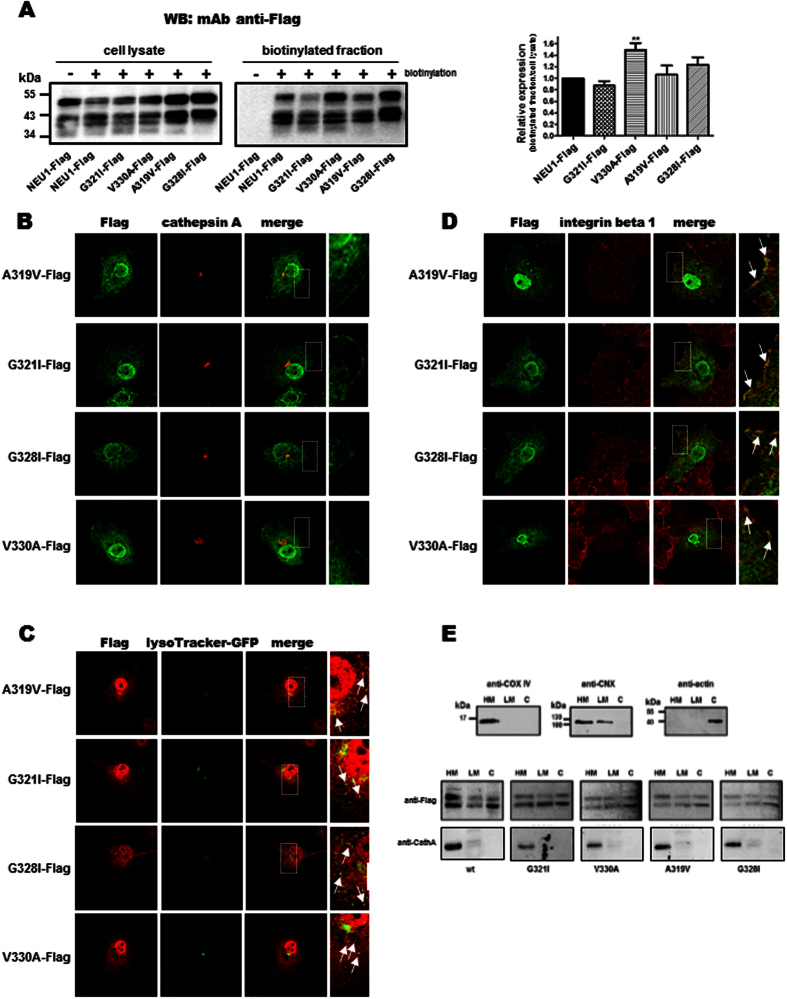
Figure 7. Characterization of the NEU1-Flag mutant expression in COS-7 cells.
(A) Top, western blot on the biotinylated fraction of COS-7 cells co-transfected with the different NEU1-Flag mutants and PPCA (1:2), and probed with a mouse monoclonal anti-Flag antibody. A representative pattern is shown. Bottom, quantification of the relative expression of the NEU1-Flag mutants in the biotinylated fraction by densitometry analysis. Relative expression was calculated as amount of NEU1-Flag mutant recovered in the biotinylated fraction over expression level in cell lysate and normalized to the control (NEU1-Flag). Results are expressed as mean ± SEM of 4 independent experiments. **P < 0.01. (B–D) Confocal images of (B) NEU1-Flag mutants and cathepsin A, or (C) NEU1-Flag mutants and lysosome, or (D) NEU1-Flag mutants and integrin beta 1 distribution in permeabilized COS-7 cells co-transfected with NEU1-Flag mutants and PPCA (1:2). (E) Subcellular distribution of the different NEU1-Flag mutants. Co-transfected COS-7 cells were lysed and subfractioned in heavy membrane (HM), light membrane (LM) and cytosolic (C) fractions. Equal amounts of proteins were subjected to SDS-PAGE and western blotting. Antibody directed against cytochrome c oxidase (COX IV), calnexin (CNX) and actin were used as markers of the different fractions. A representative pattern of three experiments is shown.

