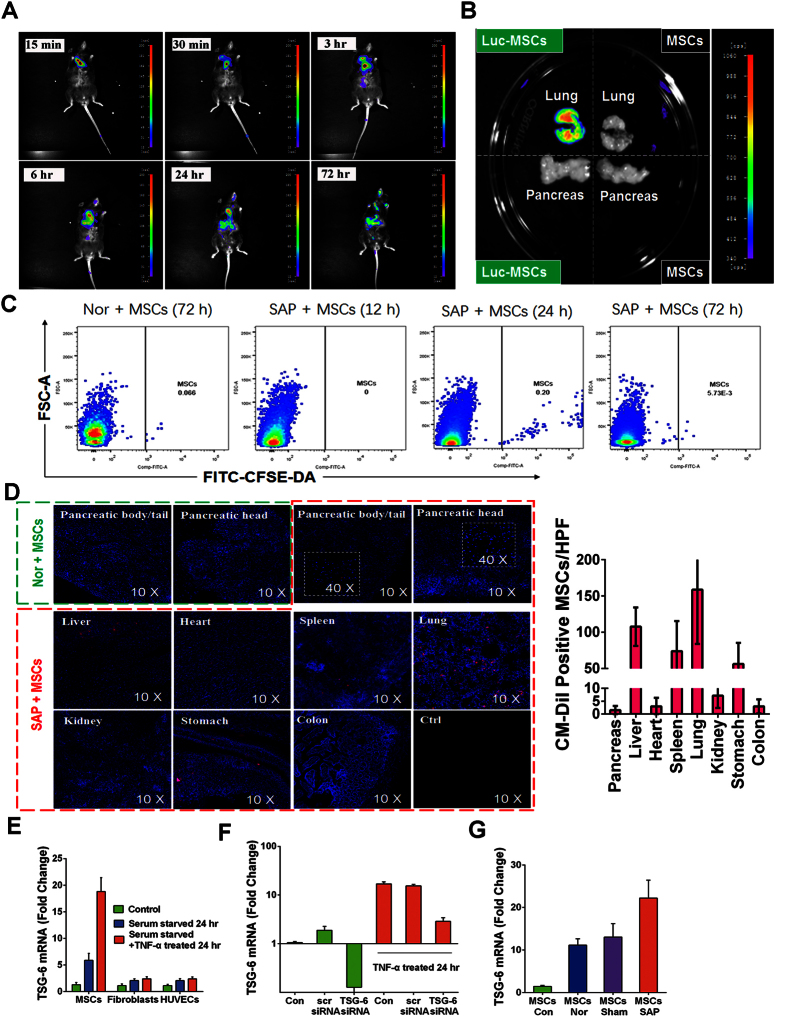
Figure 2. Tracking the distribution of human mesenchymal stem cells infused into mice via the tail vein, and activation of hMSCs or other cells to express TSG-6.
(A) The results of in vivo imaging show that Luc-hMSCs injected via the tail vein first spread in the lungs and gradually accumulated in the liver and spleen. There was no apparent signal in the pancreas throughout the entire experimental period. (B) An intense signaling was only found in the lung but not the pancreas at 72 h after the i.v. injection of Luc-hMSCs. (C) Representative Dot Plots of CFSE-DA-positive hMSC frequency at different time-points after the injection. All frequencies are referred to viable cells. (D) With the help of a confocal laser microscope, CM-Dil-labeled cells (Red) in different organs of a mouse were detected 72 h after hMSC injection and were analyzed in eight randomly selected fields from four mice at 10× or 40× magnification for each group. (E) Real-time RT-PCR assays for TSG-6 in hMSCs, human fibroblasts, and human umbilical vein endothelial cells (HUVECs) incubated in serum-free medium with or without 10 ng/mL TNF-α for 24 h. Data are presented as mean ± standard deviation; n = 5. (F) Real-time RT-PCR assays of TSG-6 in control hMSCs (Con), hMSCs transfected with a scrambled siRNA (scr siRNA), or hMSCs transduced with TSG-6 siRNA (TSG-6 siRNA). Cells were incubated in serum-free medium with or without 10 ng/mL TNF-α for 24 h. Data are presented as mean ± standard deviation; n = 3. (G) Real-time RT-PCR assays for human TSG-6 in the lungs of normal mice (hMSCs nor), sham-operated mice (hMSCs sham), and SAP mice (hMSCs SAP) 24 h after infusion of approximately 2 × 10⁶ hMSCs. hMSCs control refers to the normal growth state of these cells without any treatment. Data are presented as mean ± standard deviation; n = 3 for normal or sham-operation mice; n = 5 for SAP mice.

