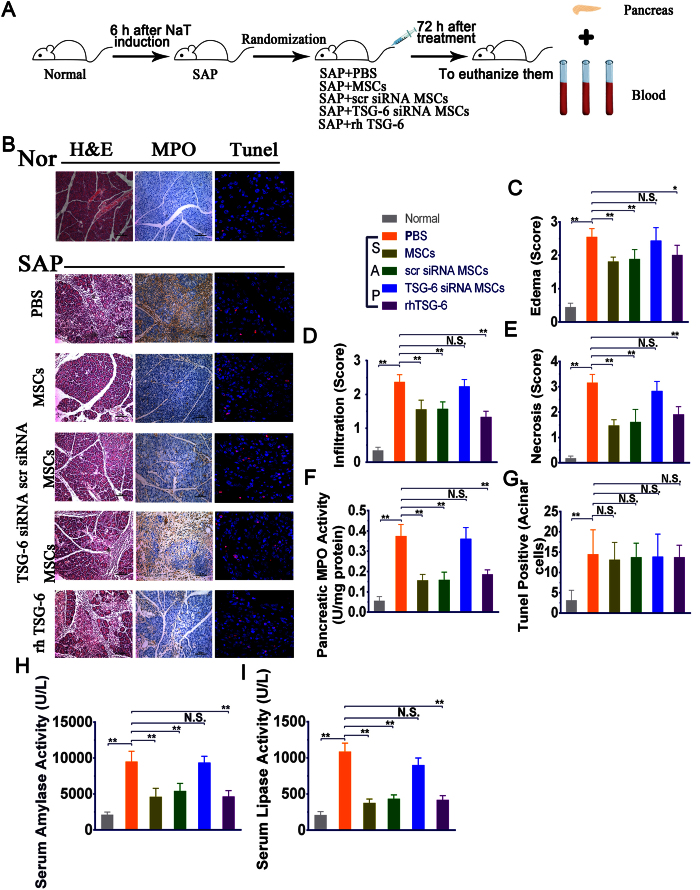
Figure 3. Effects of hMSCs, scr siRNA hMSCs, TSG-6 siRNA hMSCs and rhTSG-6 on NaT-induced alterations of pancreatic pathology and cell markers.
(A) In a separate study, mice initially received NaT by retrograde biliary and pancreatic duct infusion, followed by intravenous injection 6 hours later with PBS, hMSCs, scr siRNA hMSCs, TSG-6 siRNA hMSCs, and rhTSG-6. Mice were then sacrificed 3 days later to evaluate the cell migration and therapeutic effects. (B) Representative H&E, immunohistochemical staining of MPO and TUNEL staining in pancreatic tissue sections in each group. H&E staining evaluation revealed the effects of each treatment on pancreatic injury and inflammation, while immunohistochemical evaluation of MPO revealed the numbers of polymorphonuclear leukocytes. Original magnification: ×200. TUNEL staining revealed the number of cell s undergoing apoptosis or pyroptosis. Original magnification: ×630. (C–G) The histology scores of H&E, activity of MPO (U/mg) and number of TUNEL-positive cells after operation with i.v. administration of hMSCs, scr siRNA hMSCs, TSG-6 siRNA hMSCs and rhTSG-6. (H,I) The activities of amylase (U/L) and lipase (U/L) after operation with i.v. administered hMSCs, scr siRNA hMSCs, TSG-6 siRNA hMSCs and rhTSG-6. Each value represents the mean ± standard deviation (n = 8 or 12 per group). N.S., not significant, *P < 0.05 and **P < 0.01, compared with SAP + PBS group.

