
Figure 5. In vivo tissue binding and specificity of probe 3.
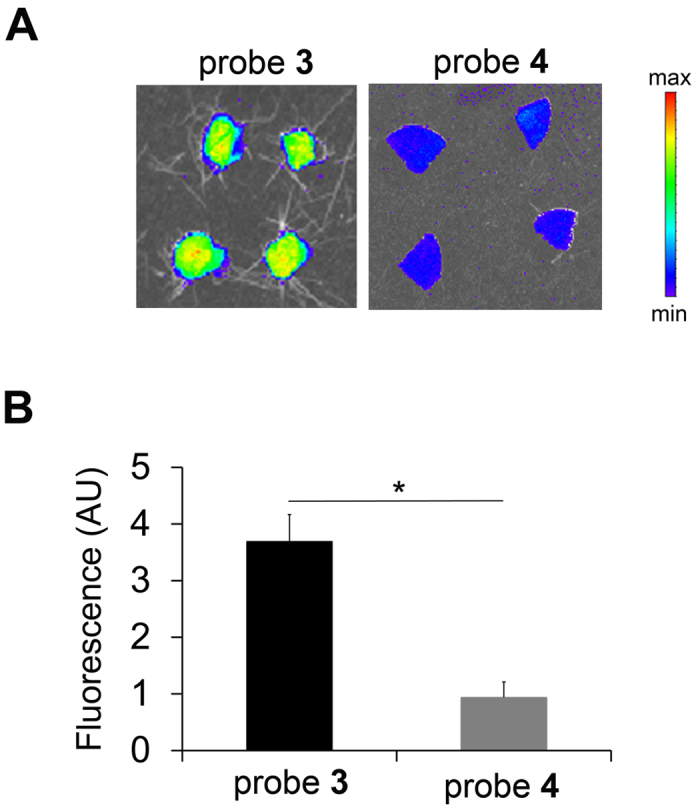
Representative fluorescent images (A) and quantitative analysis of fluorescent signal (B) of the sponges explanted at 1 h after intravenous administration of probe 3 (n = 7) or 4 (n = 2), *p < 0.05. P: probe. AU: arbitrary units.