
Figure 2. Multi-lineage differentiation of ED-iPSC lines to astrocytes, pyramidal neurons and pancreatic progenitors.
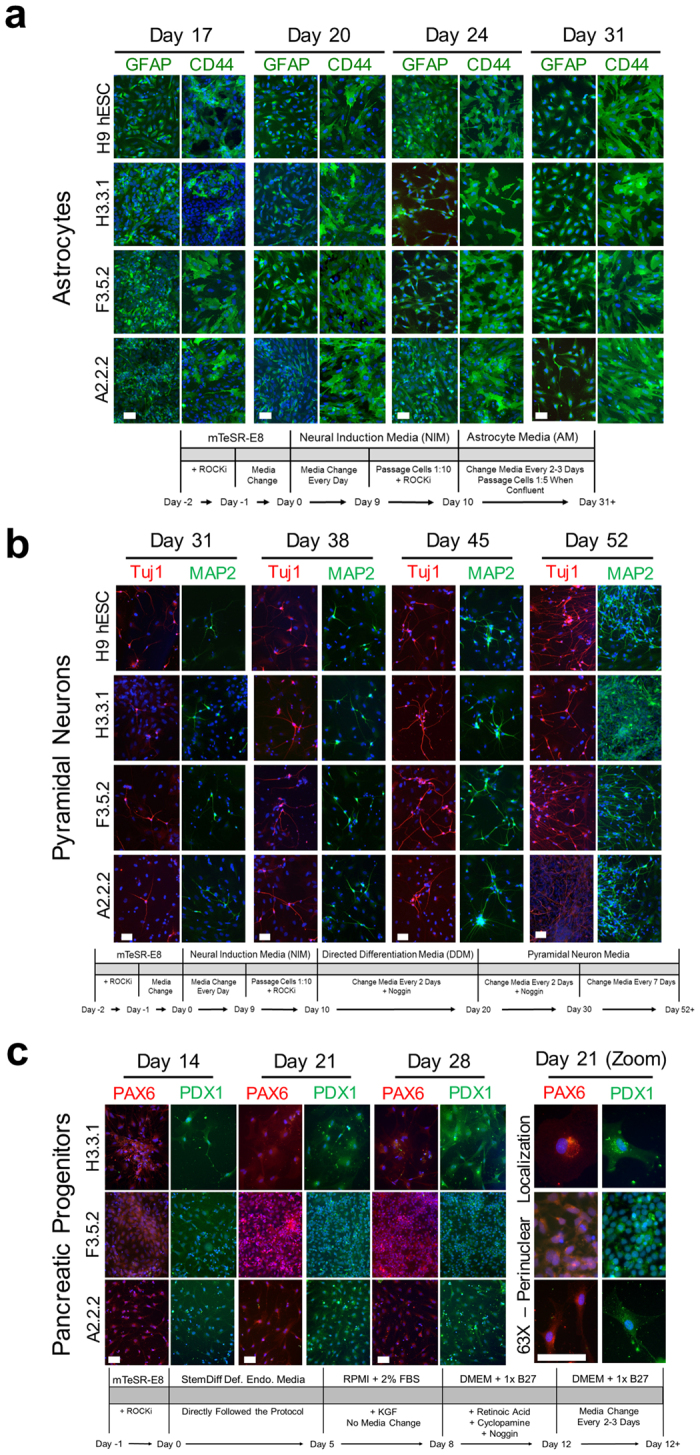
Comparative arrays of ED-iPSC lines A2.2.2, F3.5.2 and H3.3.1 showing representative images of differentiation to astrocytes, pyramidal neurons, and pancreatic progenitors following protocols outlined in the text, with detailed differentiation protocol schematics under each corresponding image sets. The hESC H9 control line was also compared for astrocytes and pyramidal neurons. Time frames shown all initiate from the pluripotent stage. (a) Astrocyte differentiation. Astrocyte-specific glial fibrillary acidic protein (GFAP) and surface marker CD44 are shown in images acquired at days 17, 20, 24 and 31 of differentiation. (b) Pyramidal neuron differentiation. Neuron biomarkers are β-III-tubulin (Tuj1, red) and microtubule associated protein 2 (MAP2, green) are shown in images acquired at days 31, 38, 45 and 52 of differentiation. (c) Early pancreatic progenitors. Expression of pancreatic-specific markers PAX6 and PDX1 are shown in images acquired at 14, 21 and 28 days of differentiation, along with a higher magnification image of PAX6 and PDX1 (day 21). Scale bars are 50 μm.