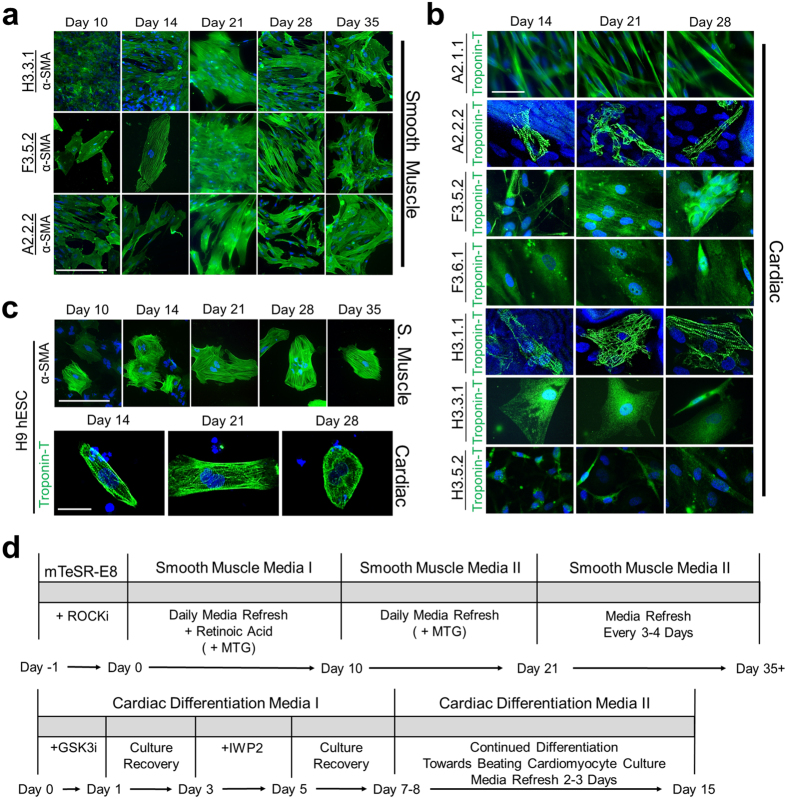
Figure 3. Mesoderm lineage differentiation of ED-iPSC lines to smooth muscle and cardiomyocytes.
Comparative arrays of ED-iPSC lines A2.2.2, F3.5.2 and H3.3.1 showing representative images of differentiation to smooth muscle and cardiomyocytes, and compared to hESC H9 following protocols outlined in the text. Time frames shown all initiate from the pluripotent stage. Representative images are shown. (a) Smooth muscle. Cells are stained for Hoechst (blue), alpha smooth muscle actin (α-SMA, green). Acquired images show days 10, 14, 21, 28, and 35 of differentiation. (b) Cardiomyocytes. Expression of the cardiomyocyte-specific marker Troponin-T (green) is shown at days 14, 21, and 28. ED-iPSC lines with unpolymerized Troponin-T did not develop a contractile phenotype. (c) Differentiation of the H9 hESC pluripotent line into smooth muscle and cardiomyocytes. (d) Detailed differentiation protocol schematics, top one illustrates smooth muscle differentiation, while bottom one shows cardiomyocyte generation protocol. Scale bars are 50 μm.

