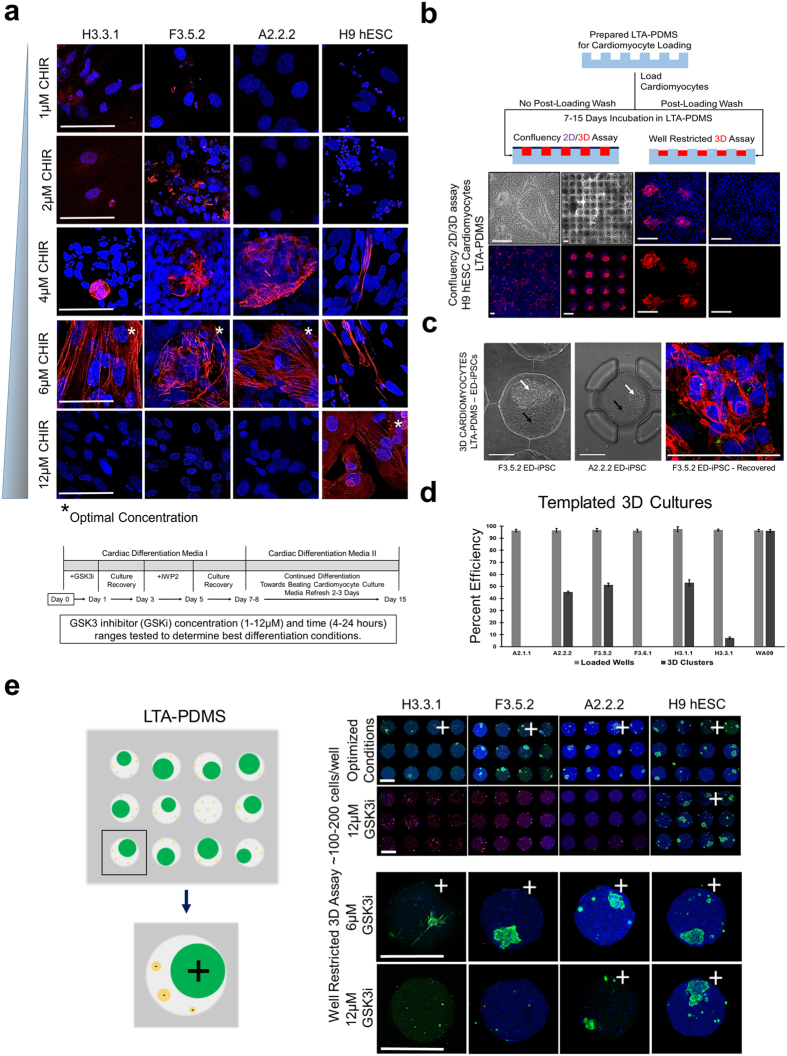
Figure 4. Chemical and physical optimization of ED-iPSC cardiomyocyte protocol.
Optimization formation of banded Troponin-T in differentiated ED-iPSC cardiomyocytes was done in in 2D cultures along with ability to form 3D aggregates using custom lithography microwells. Representative images are shown. (a) Optimizing cardiac differentiation of ED-iPSC lines A2.2.2, F3.5.2, and H3.3.1, and compared to the H9 hESC line. The GSK3 inhibitor (CHIR99021) optimal concentration and exposure time were individually determined for all lines. Asterisk (*) denotes the optimal concentration of CHIR99021 exposure at 6 hours for each line. Detailed differentiation protocol schematic is shown under the image set. Scale bars are 50 μm. (b) Lithography Templated Arrays-PDMS (LTA-PDMS) were used to efficiently quantify 3D aggregation and contractility of cardiomyocytes with Troponin-T positive staining of the same clusters. Last two columns are a zoom of the confluency 3D assays showing a merged image, nuclear stain, Troponin-T and Oct4A negative control. (c) First two images are of ED-iPSC clusters patterned in LTA-PDMS wells. White arrows point to 3D clusters, while black arrows mark empty space within the microwell. The third image shows a recovered 3D cardiomyocyte cluster from the F3.5.3 ED-iPSC line and stained for Hoechst (blue) and Troponin-T (red) with characteristic banded morphology typical of contractile cardiomyocytes. Scale bars are 100 μm. (d) Histogram of loaded LTA-PDMS grid wells versus generated contractile 3D cardiomyocyte clusters in representative ED-iPSC lines and the control H9 hESC line at optimized differentiation conditions. (e) Derived ED-iPSC and H9 hESC cardiomyocytes by our optimized protocol retain banded Troponin-T expression and contractile phenotype when seeded and grown within patterned microarray wells (LTA-PDMS). Scale bars are 200 μm.

