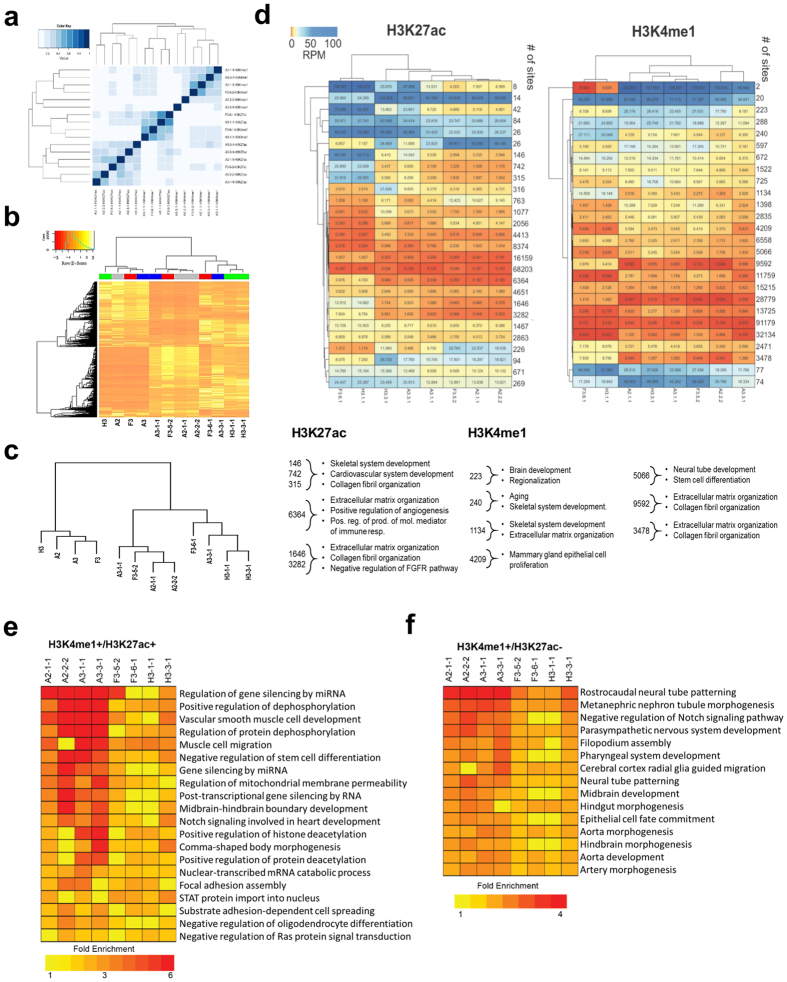
Figure 7. Hierarchical clustering and epigenomic profiling of ED-iPSC and initial fibroblast lines.
(a) Jaccard analysis comparison between the ED-iPSC lines based on enriched peaks for H3K27ac and H3K4me1 ChIP-seq data. The Jaccard index is defined as the ratio of the combined length of the genomic regions within both samples (intersect) and in at least one sample (union). The A2.1.1, A2.2.2, A3.1.1, A3.3.1, F3.5.2, F3.6.1, H3.1.1, and H3.3.1 represent the eight investigated ED-iPSC cell lines. (b) Heatmap of hierarchical clustering using union of genes differentially expressed between ED-iPSCs and corresponding initial fibroblast cells. (c) Dendrogram showing the hierarchical clustering of replicate lines within self-identified ethnicity and between the ethnically diverse lines. (d) Comparison of ED-iPSC at the epigenomic level by clustering ChIP-seq coverage at all genomic locations for H3K27ac and H3K4me1. The number of sites for each clustered group is shown with the red to blue color gradient represents coverage value expressed as reads per million (rpm) for each sample. Significantly enriched GO-Biological process were determined by GREAT and is listed below the heatmap. Enriched GO-Biological Processes were determined for active regions defined as H3K4me1 + /H3K27ac + (e) and for primed regions defined as H3K4me1 + /H3K27ac- (f).

