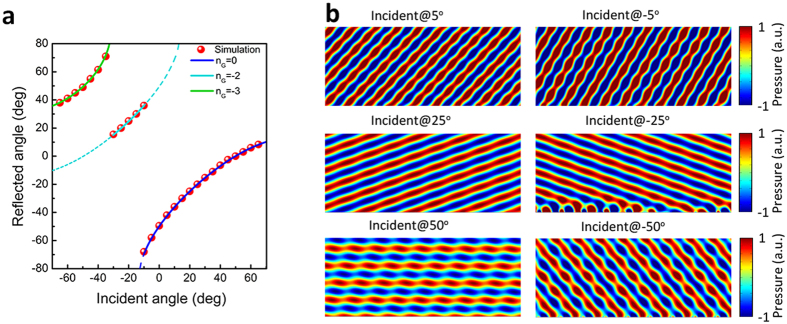
Figure 3. The apparent negative reflection behavior of the gradient acoustic metasurface when ξ = −0.762 k0.
(a) The relation between the incident angle and reflected angle when ks = −0.762. The red dots are data obtained from the full-wave simulation. The blue solid line indicates the anomalous reflection state  , the cyan and green solid lines represent the allowed apparent negative reflection states
  and
and  respectively. (b) Calculated scattered acoustic field under the plane acoustic wave illumination of different incident angles.

