
Fig. 5.
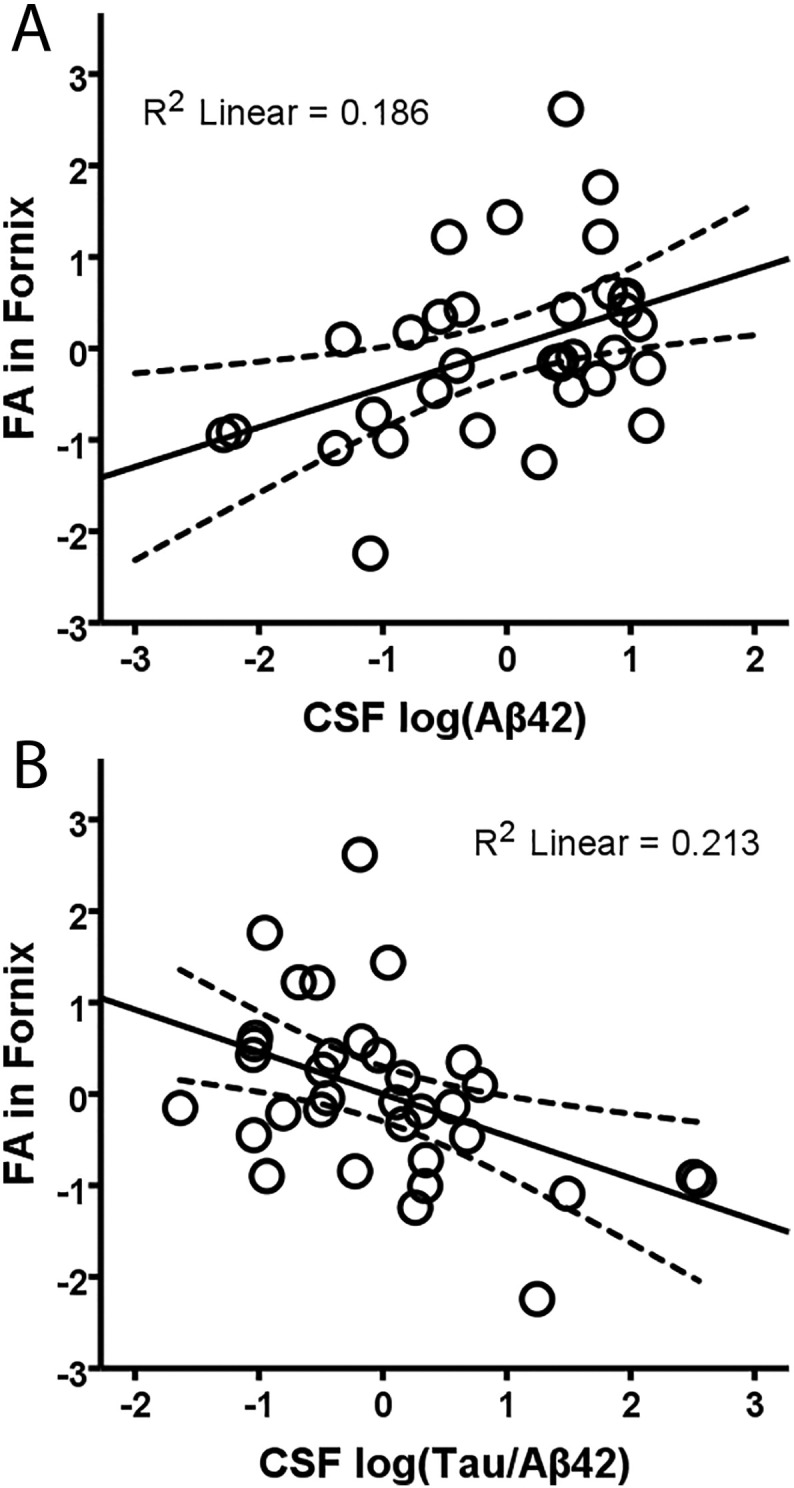
Relationship between CSF proteins and FA in the merged younger-older fornix template. Regression of FA in the merged younger-older template against CSF Aβ42 (A), and t-tau/Aβ42 ratio (B) when controlling for the effects of age and sex. Significant relationships show that lower FA (worse white matter microstructure) in the fornix is associated with worse AD-related pathology markers. R2 linear values are for the linear best fit (solid line), and dashed lines indicate the 95% confidence interval for the mean response.