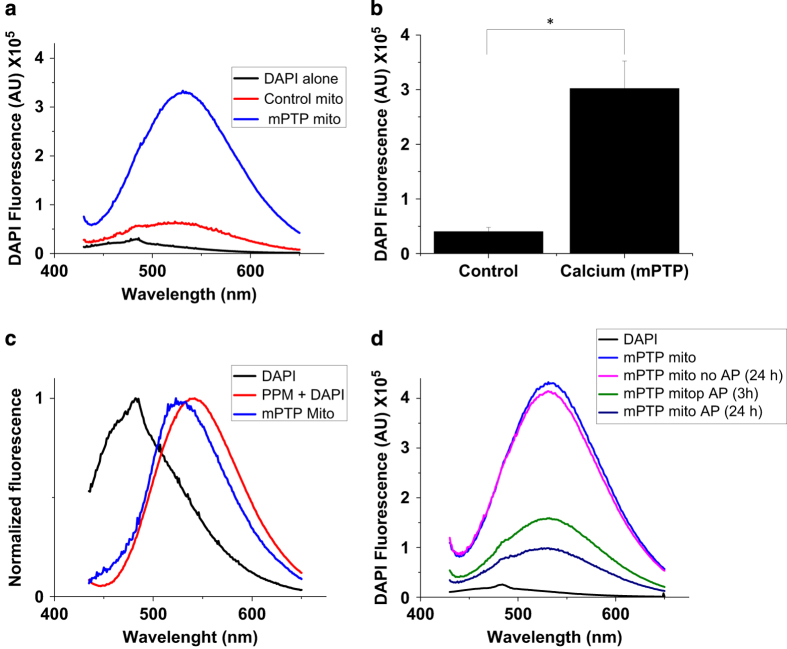
Figure 4.
mPTP activation increases polyP levels in the channel-forming fraction. (a) Emission spectra of DAPI in the presence of the extracts purified from mitochondria treated with 10 mM Ca2+ to induce mPTP (blue) and control (red). The black line shows the emission spectrum of DAPI alone. (b) Combined data of the values of peak DAPI fluorescence from three independent experiments. Note the significant increase in the amount of polyP in treated calcium samples (blue) when compared with control (red; t-test, *P<0.002). (c) Comparison of the emission spectra of DAPI alone (black), synthetic polyP (PPM, 60 phosphates, red) and purified fraction (blue); (d) Alkaline phosphatase (AP) treatment shows a decrease in the DAPI fluorescence confirming the presence of polyP.

