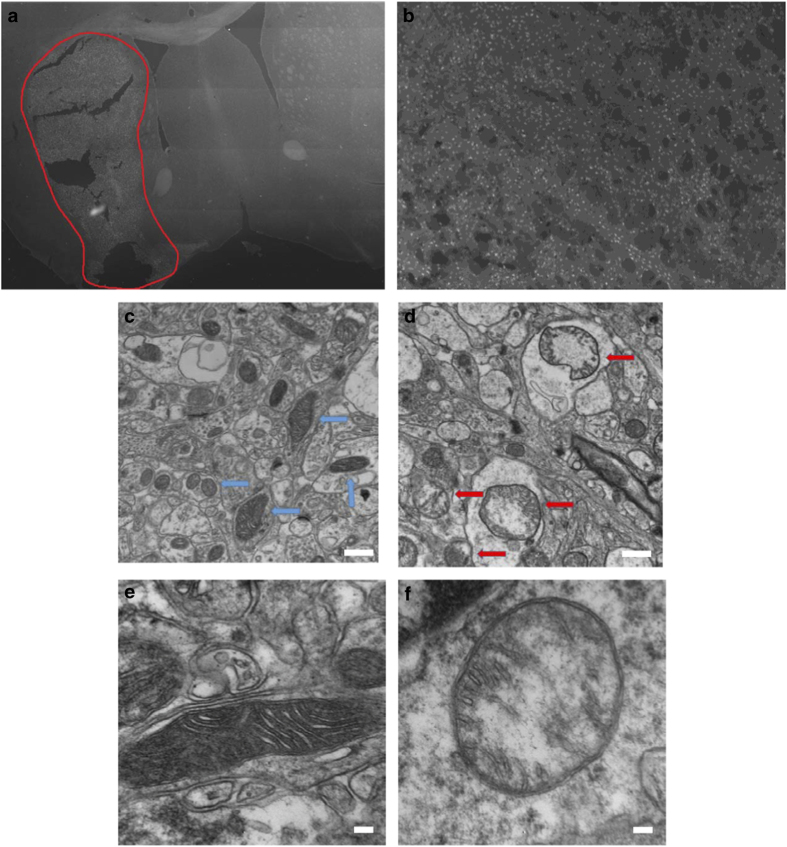
Figure 5.
Characterization of the cell and mitochondrial damage following ischemia. (a) Representative 10×10 tile stained with Fluoro-Jade to identify degenerating neurons. The picture is representative of the damage observed in the striatum of animals following HI-induced brain injury. The damaged area is outlined by the red line. (b) Image of an individual tile at ×10 magnification representative of the damage observed in the striatum. (c) EM image of control brain tissue with fully intact mitochondria marked with blue arrows. (d) EM image of damaged area showing damaged mitochondria with loss of normal cristae structure, marked by red arrows. (e and f) EM images of control and damaged mitochondria at increased magnification. Scale bars are 500 nm for c and d; 100 nm for e and f.

