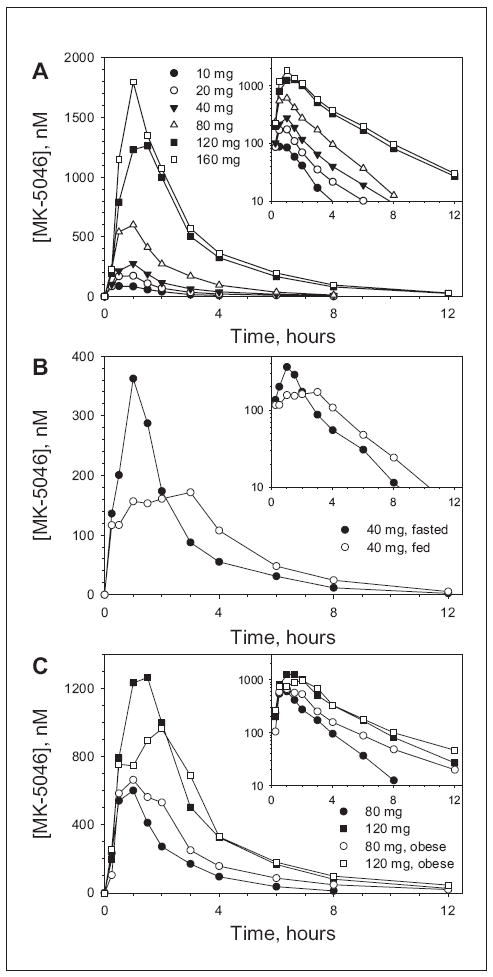
Figure 1.

Plasma concentration-time profiles of MK-5046 after ingestion of single oral doses by male patients. Large plots are linear scale; insets are the same data using a log scale. (A) Single doses administered in the fasted state. Data are arithmetic means; n = 6 (N = 12 for 40 and 160 mg) healthy male patients/group of the indicated doses. (B) Single doses of 40 mg administered in fasted state (•) and after standard, high-fat breakfast (◦). Data are arithmetic means; n = 6 healthy male patients/group. (C) Single doses administered in the fasted state to cohorts with different mean body mass indexes (BMIs); (26.4 kg/m2, closed symbols; 32.8 kg/m2, open symbols). Data are arithmetic means; n = 6 patients/group.
