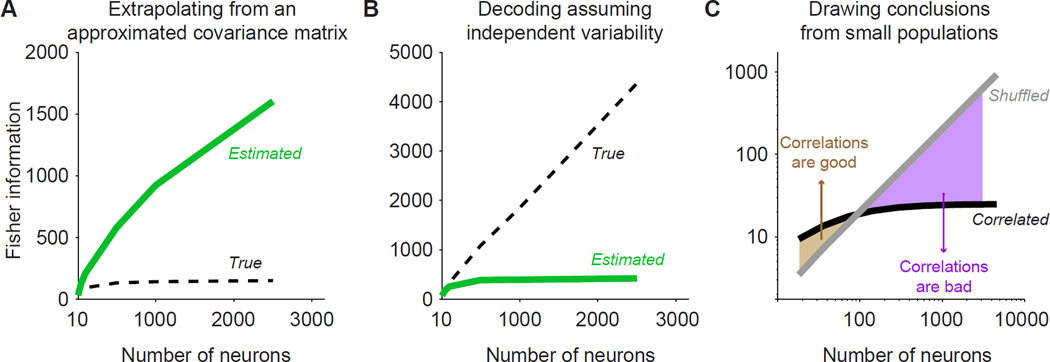
Figure 3. Common errors in estimating information.
(a) Information in neural data can be severely misestimated when based on simulated data that approximate measured responses. Consider a synthetic population with differential correlations. For each population size N (abscissa), the true information is computed from the full population (dashed line) and shows clear saturation for large populations. The information estimated using an approximation to the true covariance matrix (green line) shows no saturation, yielding estimates that vastly exceed the true information. The estimated covariance matrix is constructed as in Moreno-Bote et al. (2014), figure 7a. Briefly, half the entries in the matrix are set to the measured value; the remaining entries are filled in by resampling the measured coefficients and enforcing that the resulting matrix is a covariance and that it has the same limited-range structure as the original data. (b) Suboptimal decoding can severely underestimate the true information in the population. Consider a heterogeneous population without differential correlations (model of Ecker et al. 2011). The true information grows with population size (dashed line); the information estimated by a suboptimal, factorized decoder (green line) saturates, underestimating the true information. The factorized decoder is the correlation-blind decoder of Pitkow et al. (2015). (c) Conclusions about the importance of correlations based on small populations do not always apply to larger populations. Consider a synthetic population with homogeneous tuning and multiplicative global fluctuations (model and parameters of Lin et al. 2015, figure 8E, with a coefficient of variation of 0.4), plus a small amount of differential correlations. For each population size (abscissa), the true information (black line) is computed from the true tuning and covariance matrix; the shuffled information (gray line) is computed after removing correlations (i.e., setting the off-diagonal entries of the covariance matrix to zero). For populations of tens of neurons, removing correlations reduces information, suggesting that correlations are helpful (brown shaded area). For larger population sizes, the true information saturates while the shuffled information grows linearly, showing correlations are harmful (purple shaded area). Thus, the conclusion that correlations increase information does not apply when considering populations that are likely to underlie function.

