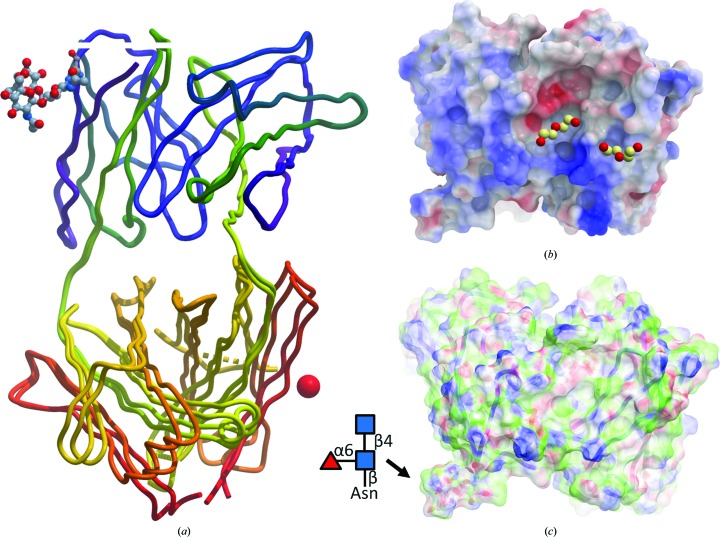
Figure 3.
Overall structure of the N14 anti-afamin antibody Fab fragment. (a) provides an overview of the N14A3 and N14C3 structure models superimposed on the VL and VH domains. The different domain orientation of the constant regions is distinctly recognizable, with the larger elbow angle of N14A3 pushing the CL and CH domains wider apart, which may be one contributing factor to the 5% larger unit-cell volume of N14A3. The backbone traces are shown as tube models coloured from the N-terminus (dark blue) to the C-terminus (red), with the location of the K+-binding site in N14C3 indicated by a red sphere and the Asn26L glycosylation shown as a ball-and-stick model. (b) Electrostatic surface presentation (blue, positive charge; red, negative charge) of the antigen-binding region (including the glycan, bottom left). The deep cleft between the VL and VH chains in the centre of the solvent-exposed CDR region contains a PEG fragment embedded in a discrete water network (not shown). The second PEG fragment to the right mediates a crystal contact. The displayed PEG fragments are present in both structures. (c) Surface map of binding properties: white, neutral surface; green, hydrophobic surface; red, hydrogen-bonding acceptor potential; blue, hydrogen-bond donor potential. In (b) and (c) the glycan branch can be seen protruding at the bottom left. Surface calculations and figure rendering by MolSoft ICM Browser Pro (Abagyan et al., 1994 ▸).

