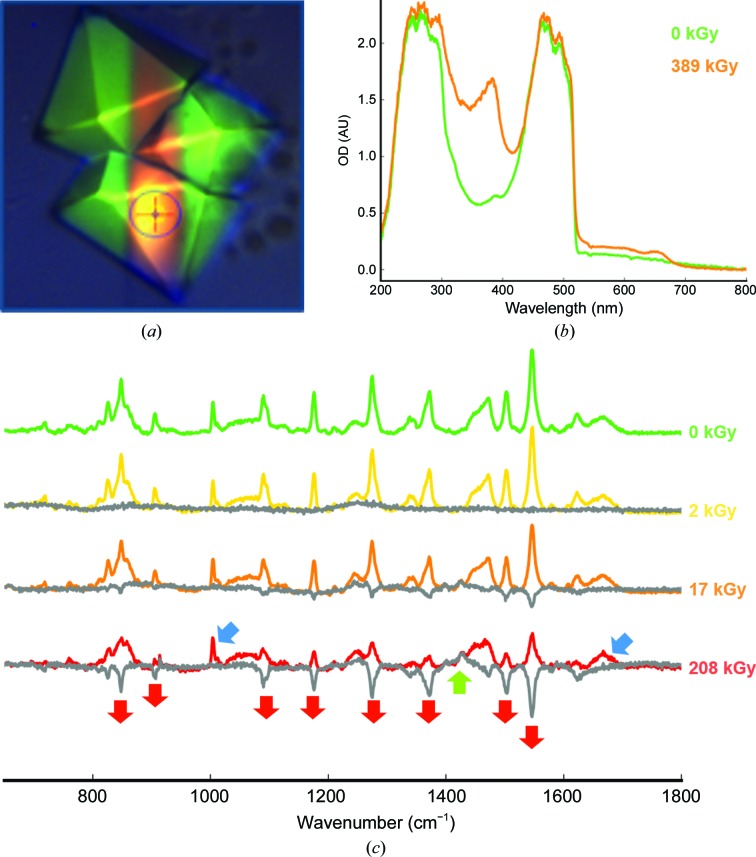
Figure 5.
X-ray-induced spectroscopic changes of mNeonGreen. (a) Picture of mNeonGreen crystals after a 730 kGy X-ray data collection. (b) UV–visible absorption spectra of the irradiated (orange trace) and non-irradiated (green trace) areas of an mNeonGreen crystal. (c) Series of online Raman spectra measured on an mNeonGreen crystal with increasing X-ray dose. Grey traces correspond to spectra subtracted for the zero-dose spectrum. Blue arrows indicate invariant peaks characteristics of proteins, red arrows indicate decreasing peaks and the green arrow indicates an increasing peak.

