Figure 6.
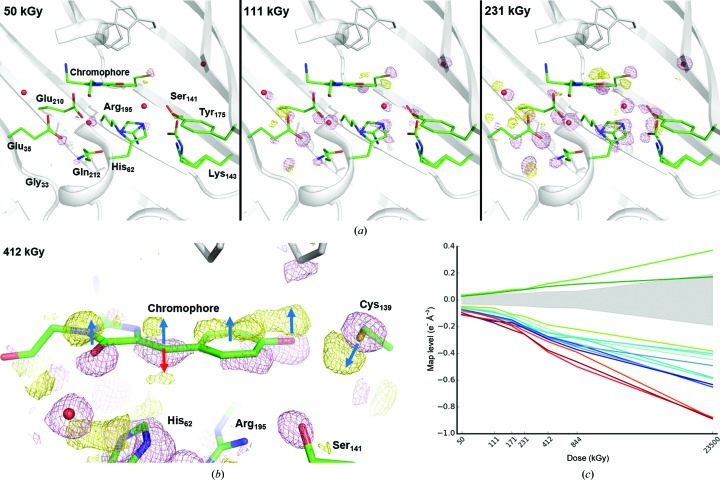
X-ray-induced structural changes in the chromophore cavity of mNeonGreen. (a) Fourier difference maps F o(n) − F o(1) at increasing X-ray doses contoured at a 6.0σ level (pink, negative; yellow, positive). (b) Close-up on the chromophore at a 4.0σ level after 412 kGy. Dark blue arrows indicate the upward movement of the whole chromophore and the opposite movement of Cys139. The red arrow indicates the concomitant formation of a kinked configuration of the chromophore upon loss of conjugation at the exocyclic linkage. (c) X-ray-induced electron loss or gain displayed as a function of X-ray dose on a logarithmic scale. Three ensembles of affected groups can be distinguished: damage to Glu35, Glu210 and the water in between is represented in red, damage to the methylene bridge in green and strong damage to other groups listed in Table 3 ▸ in blue. The noise level (corresponding to peak heights with a σ level between −3.0 and +3.0) at each dose is represented by a light grey shade.

