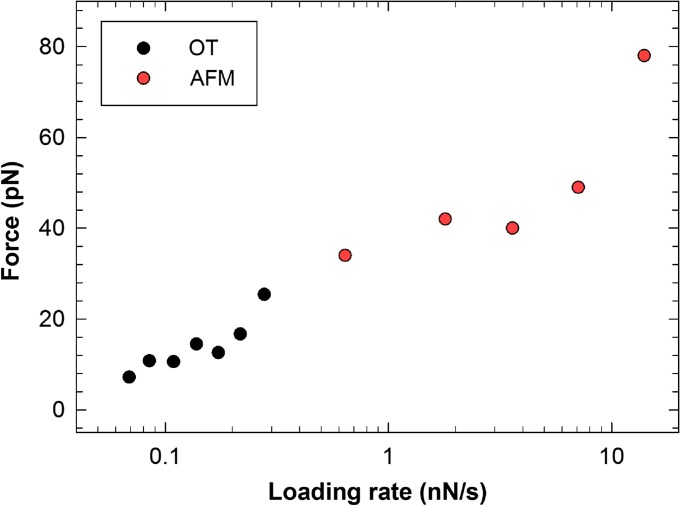
Fig. 7.
The strength of the Tn-MUC1 self-interactions determined by direct unbinding experiments performed using AFM (red points) and OT (black points). Combining the two techniques gives access to a broader range of loading rates than what can be provided by each of the two techniques separately. This figure is available in black and white in print and in color at Glycobiology online.

