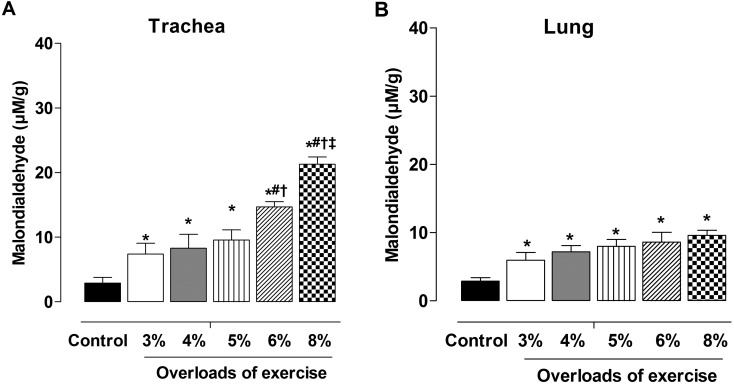
Fig. 4.
Levels of lipid peroxidation in trachea (A) and lung (B) in control, G3, G4, G5, G6 and G8 groups. Data are reported as means ± SEM (n=5 per group). G3, G4, G5, G6 and G8: exercise intensity based on loading with 3, 4, 5, 6 and 8% of body weight, respectively, during swimming exercise. *P< 0.05 vs. control; #P<0.05 vs. G4; †P<0.05 vs. G5; ‡P<0.05 vs. G6 (one-way ANOVA test).

