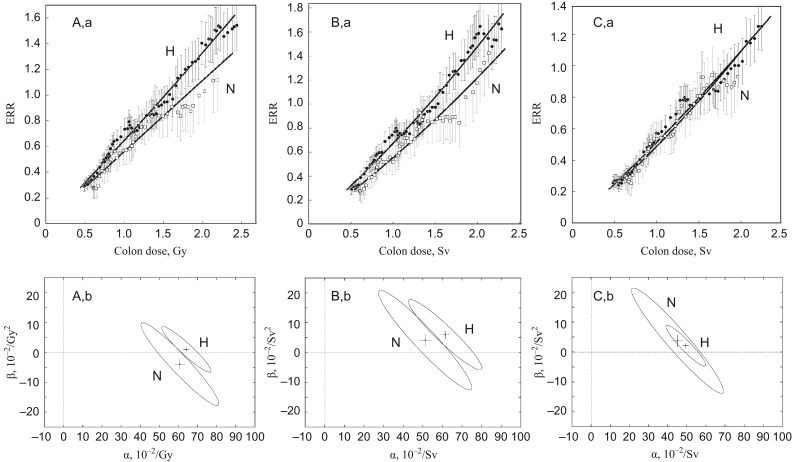
Fig. 3.
Dose–responses of excessive relative risk (ERR) of solid cancers in Hiroshima and Nagasaki (upper panel) and the testing of their statistical significance between two cities by 95% joint confidence regions (lower panel). (A) Unadjusted colon dose with neutrons weighted by RBE = 1 (coluDS02w1). (B) Adjusted colon dose with neutrons weighted by RBE = 10 (colaDS02w10). (C) Unadjusted colon dose with neutrons weighted by dose-dependent variable RBE (coluDS02wgn). Vertical and horizontal lines in the confidence ellipse show the SEs of the mean. For dose-dependent variable RBE, see Eq. (3). H = Hiroshima, N = Nagasaki.

