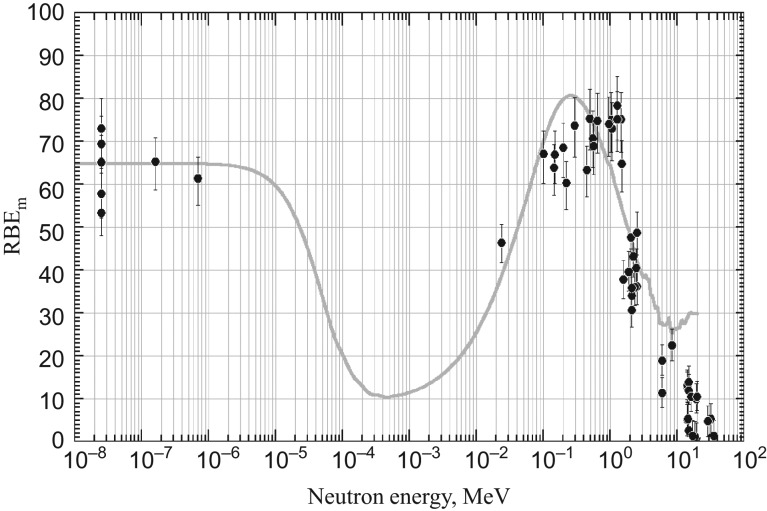
Fig. 6.
Average RBEm, i.e. mean quality factor of neutron, Qn, calculated from microdosimetry spectra of various neutron fields plotted against neutron energy. Vertical lines represent the 95% confidence intervals derived from curve fitting of r(L). The thin curve represents the mean quality factor of neutron, Qn, of Schuhmacher and Siebert [71] after rescaling by the r(L)max/Q(L)max ratio of the radiation quality factor.

