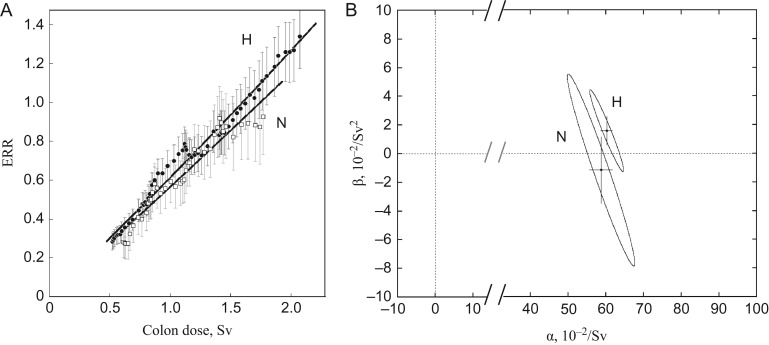
Fig. 9.
Dose–responses for ERR of solid cancer in Hiroshima (H) and Nagasaki (N) and test for difference by 95% joint confidence intervals (CIs). Doses are unadjusted colon dose, coluDS02wmix, in which neutrons were weighted by R(Dγ,Dn) for the γ-dependence model. (A) Dose–response relationships. The vertical lines represent the 80% CIs. (B) The 95% joint CIs are based on the χ2 distribution and shown in half size. The vertical and horizontal lines within the ellipse represent the SEs of the mean.

