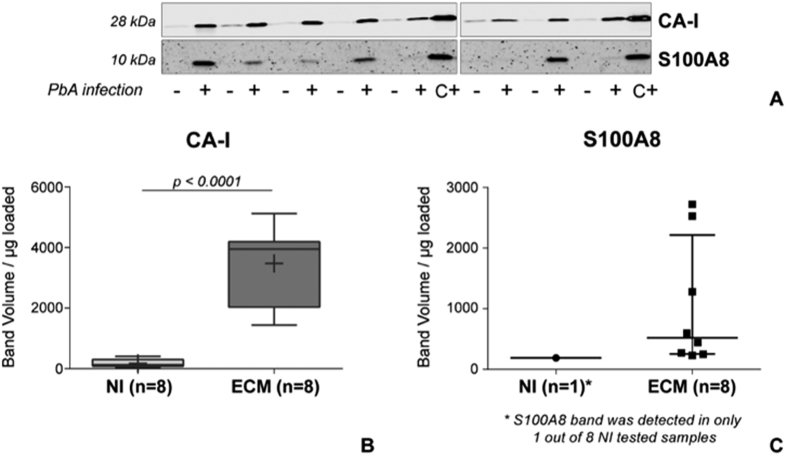
Figure 6. Western blot results for CA-I and S100A8 detection in murine MP.
(A) Detection of CA-I and S100A8 in MP samples (2.5 μg/lane left blot image, 1.8 μg/lane right blot image) from non-infected (−, NI, n = 8) and PbA-infected (+, ECM, n = 8) DBA/1 mice. A positive control (C+) consisting of murine spleen extract was included in each experiment. (B) Quantification of CA-I expression in murine plasma MP, showing its significantly higher expression in ECM samples (t-test). In each boxplot mean is reported as +. (C) S100A8 was detectable in only 1 out of 8 NI samples, while it was expressed in all ECM samples. The quantification of the detected bands is reported in the graph, where the horizontal line represents the median band volume and the error bars the interquartile range.

