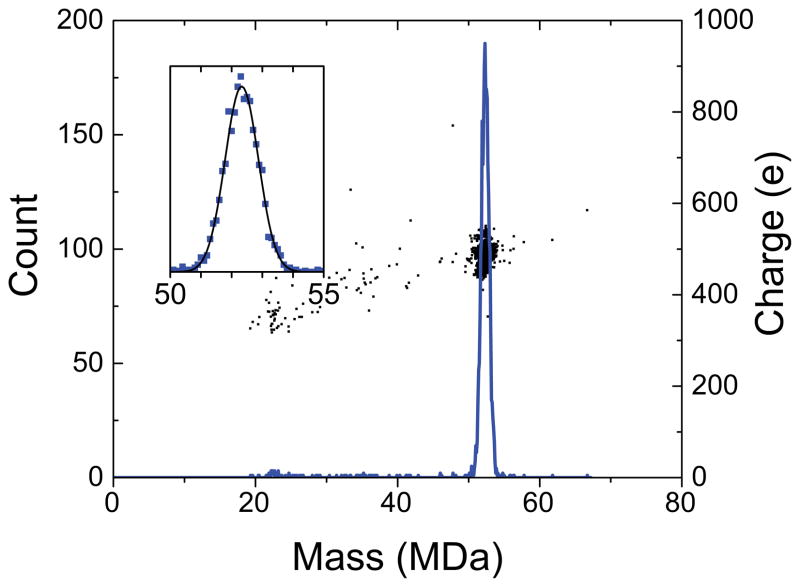
Figure 3.
Mass spectrum of phage P22 measured with CDMS. The spectrum is a histogram constructed with 100 kDa bins. The inset shows an expanded view of the peak at around 52 MDa. In the inset, the blue points are the measured values and the black line is a Gaussian fit to the experimental data. The black points overlaying the main spectrum are a charge vs mass scatter plot showing that the average charge of the phage is about 490 e.

