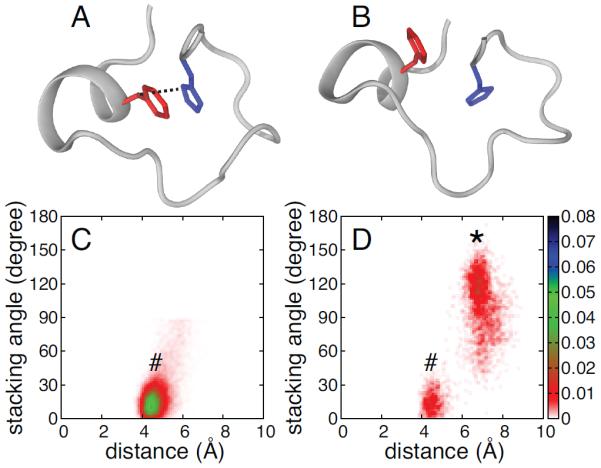
Figure 4.

Aromatic side chain stacking of phenylalanine and histidine in ZF2. Representative ZF2 structures for TTP showing F150 (red) and H166 (blue) side chains stacked (A) and not stacked (B). Probability density distributions of the stacking angle and distance between the aromatic rings are shown for F200 and H216 in TIS11d (C) and for F150 and H166 in TTP (D). In the figure, conformations where the phenylalanine and histidine side chains are stacked (as shown in A) and not stacked (as shown in B) are represented by a # or a *, respectively. The stacking angle was calculated as the angle between the normals of the two aromatic rings (the planes for the side chains are defined by atoms Cδ2, Cε1 and Nε2 for histidine and Cζ, Cε2, Cδ2 for phenylalanine). The distance between the aromatic rings was calculated as the distance between the centers of mass for the heavy atoms of the two side chains. The color bars show the values of the probability density calculated for the stacking angle and distance as the number of counts normalized by the total number of observations and by the area of each bin. Configurations and distributions were extracted from the unfolding MD trajectory for TTP (100 ns) and from six 100 ns MD trajectories for TIS11d.
