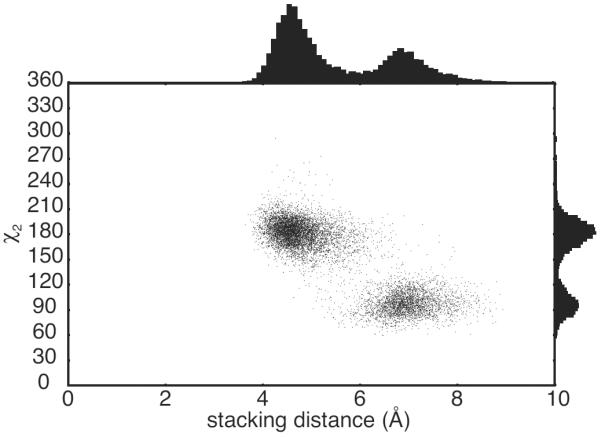
Figure 5.

H166 in TTP populates the rotameric conformation with χ2 = 90° upon loss of stacking with F150. Scatter plot of the stacking distance between the aromatic ring of F150 and H166 of TTP and the χ2 dihedral angle of H166. Probability distributions of the stacking distance and χ2 dihedral are shown on the axes. The distance between the aromatic rings was calculated as the distance between the centers of mass for the heavy atoms of the two side chains. Data were extracted from the three MD trajectory for TTP.
