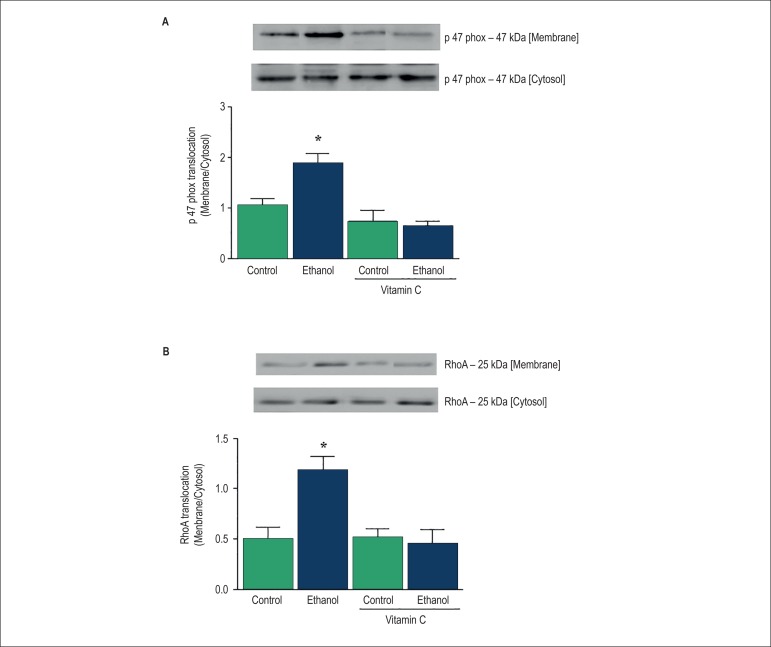
Figure 5.
Effects of acute ethanol intake on p47phox and RhoA translocation in the rat mesenteric arterial bed (MAB). Bar graph represents translocation of p47phox and RhoA as a ratio of membrane/cytosol expression (A and B) in the rat MAB. Top panels: representative immunoblots. Results are presented as mean ± SEM of 5-7 experiments. *Compared with control, control plus vitamin C and ethanol plus vitamin C (p<0.05, ANOVA).

