Figure 1.
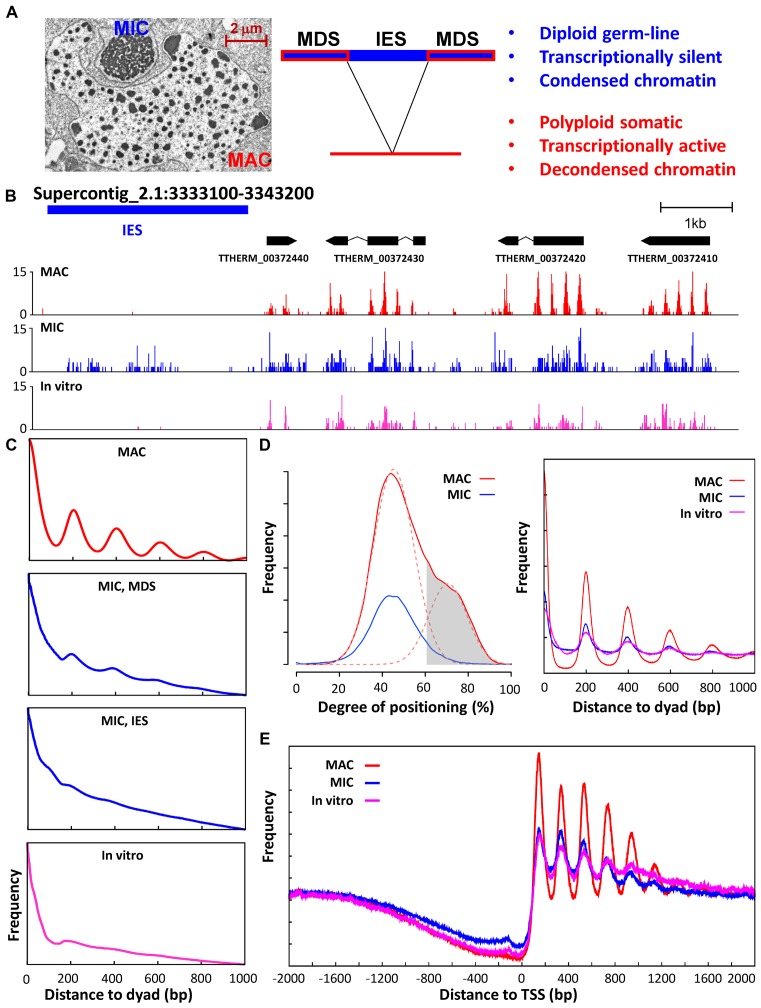
Positioned nucleosomes are abundant in transcriptionally active MAC, but depleted in transcriptionally silent MIC. (A) Two types of structurally and functionally differentiated nuclei in Tetrahymena. Left, an electron micrograph showing the structurally differentiated macronucleus (MAC) and micronucleus (MIC), enclosed by their own nuclear envelope and contained in the same cytoplasmic compartment. Middle, DNA elimination accompanying MIC to MAC differentiation: IES, internal eliminated sequences, MIC-specific; MDS, MAC-destined sequences, shared between MAC and MIC. Right, functional differentiation of MAC and MIC. (B) Nucleosome distribution in a representative genome region. Paired-end MNase-Seq results from MAC (red), MIC (blue), and in vitro (magenta) (25) are mapped to the MIC genome. Distribution of fragment centers representing nucleosome dyads is plotted, together with models for genes and IES. (C) Phasogram of nucleosome distribution in MAC (red), MIC (blue), and in vitro (magenta) (25). x-axis: distance to fragment center (dyad); y-axis, frequency at a designated distance. MIC result is mapped to MDS and IES separately; MAC and in vitro results are mapped to MDS. (D) Nucleosome positioning and long-range order. Left, Nucleosome positioning in MAC and MIC. The distribution of degrees of nucleosome positioning in MAC (red solid line) can be decomposed into two peaks of normal distribution (red dashed line), with the left peak representing more delocalized nucleosomes and the right peak representing well-positioned nucleosomes. Well-positioned nucleosomes in MAC (gray area, 61% cutoff) are selected for further analysis. They have significantly reduced degrees of translational positioning in MIC (blue), similar to the more delocalized nucleosomes in MAC (red dashed line, left peak). See Methods for details and Supplemental File S1 for a compilation of properties of called nucleosomes. Right, composite analysis of nucleosome positioning in MAC (red), MIC (blue), and in vitro (magenta) (25), aligned to the dyads of well-positioned nucleosomes in MAC. (E) Composite analysis of nucleosome positioning in MAC (red), MIC (blue), and in vitro (magenta) (25), aligned to TSS. Distribution of fragment centers around TSS (±2kb) is aggregated over 15,841 well-modeled genes. See Methods for details and Supplemental File S2 for a compilation of properties of well-modeled genes.

