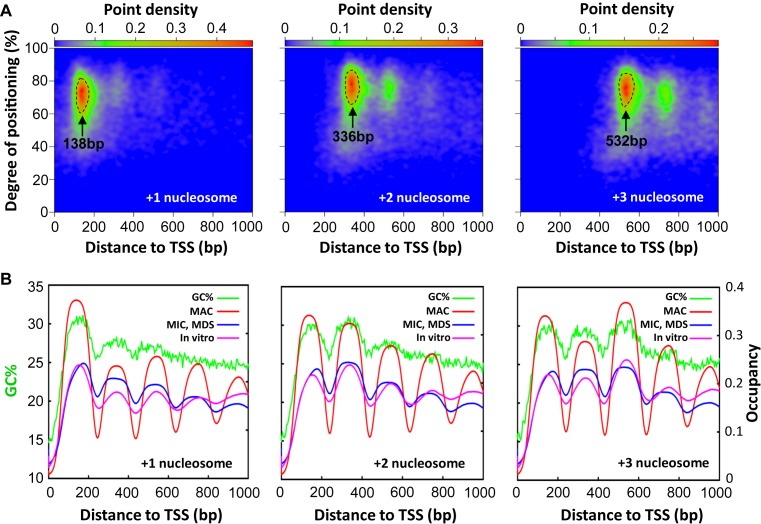
Figure 3.
Well-positioned nucleosomes in the gene body are coordinated by cis-determinants. (A) Distribution of called nucleosomes in the gene body, according to their distances from TSS (x-axes) and degrees of translational positioning (y-axes). Note the clustering of nucleosome distributions (point density in color scales). These strongly clustered +1, +2 and +3 nucleosomes, their peak positions relative to TSS as indicated, are selected for further analysis (enclosed by dashed lines). See Methods for details and Supplemental File S1 for a compilation of properties of called nucleosomes. (B) In phase oscillations of nucleosome occupancy and GC% downstream of TSS. Nucleosome occupancy in MAC (red), MIC (blue), and in vitro (magenta) (25) is aggregated over the genes containing the selected +1, +2 and +3 nucleosomes enclosed by dashed lines in the top panels. GC% distribution (green) is superimposed.

