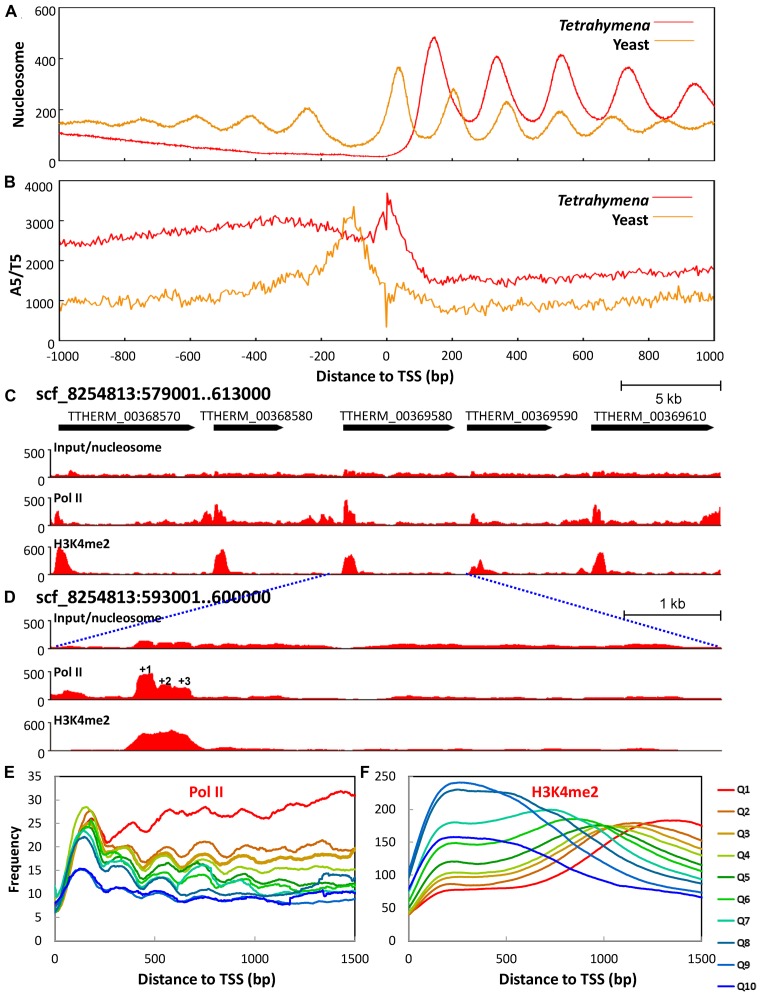
Figure 4.
The +1 nucleosome is implicated in Pol II pausing. (A) The +1 nucleosome placement is further downstream of TSS in Tetrahymena than in yeast. Nucleosome distribution around TSS (± 1 kb) is aggregated over 15,841 well-annotated genes in Tetrahymena (Supplemental File S2) and 2231 genes in yeast (71). Note the downstream placement of the +1 nucleosome (yeast: 56 bp; Tetrahymena: 138 bp), increase in NRL (yeast: 167 bp; Tetrahymena: 200 bp), and a lack of nucleosome arrays upstream of TSS, when Tetrahymena is compared with yeast. (B) Poly (dA:dT) tract distribution relative to TSS in Tetrahymena (red) and yeast (beige). A5/T5 (AAAAA or TTTTT) distribution around TSS (± 1kb) is calculated using the 5 bp bin. C) Distribution of nucleosome, Pol II, and H3K4 methylation (from top to bottom) in a genomic region. Raw coverage of the input (nucleosome) and ChIP-Seq DNA fragments (Pol II and H3K4 methylation) was shown. Note the enrichment of Pol II and H3K4 methylation at the 5′ end of the gene body. (D) Zoom-in of a region containing a single gene. Note Pol II enrichment at the +1 nucleosome. (E) Composite analysis of Pol II distribution in the gene body. Well-modeled long genes (≥1.5 kb) are ranked from high to low by their expression levels and divided into 10 quantiles. Normalized Pol II distribution around TSS is aggregated over all genes in a quantile. (F) Composite analysis of H3K4 methylation in the gene body.

