Figure 6.
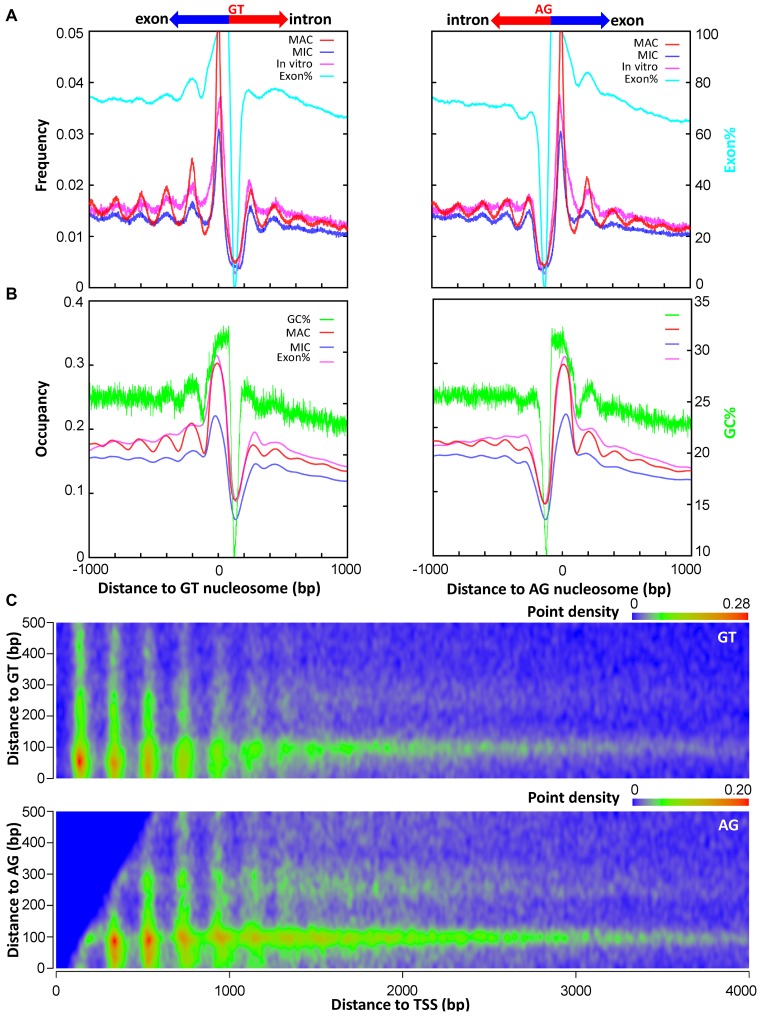
Splice sites are flanked by positioned nucleosomes. (A) Composite analysis of nucleosome positioning in MAC (red), MIC (blue), and in vitro (magenta) (25), aligned to the dyads of the called nucleosomes flanking splice sites (left: GT, right: AG). The distribution of exon% (pale blue), calculated as the probability that a particular position containing exons, is superimposed. See Methods for details. (B) Composite analysis of nucleosome occupancy in MAC (red), MIC (blue), and in vitro (magenta) (25), aligned to the dyads of the called nucleosomes flanking splice sites (left: GT, right: AG). The distribution of GC% (green) is superimposed. Note the correlation between nucleosome arrays near splice sites and oscillations of GC%. (C) Distribution of called nucleosomes in the gene body, according to their distances from TSS (x-axes) and splice sites (y-axes; top: GT; bottom: AG). Note the clustering of nucleosome distribution along both the x- and y-axes (point density in color scales). See Supplemental File S1 for a compilation of properties of called nucleosomes.

