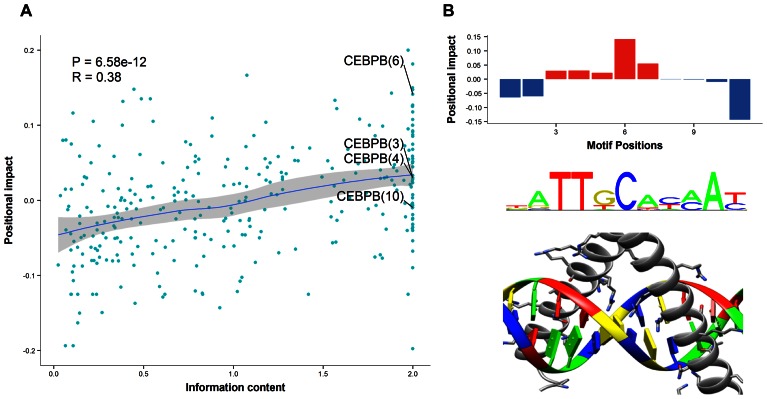
Figure 2.
Information content and positional impact of each position within TFBS. (A) Correlation between positional impact and information content. Each point corresponded to a position (given in parenthesis) within TFBSs associated to ChIP'ed TFs. Positions were plotted with respect to their associated information content (x-axis) from the TF motif and positional impact (y-axis). The trend line was drawn by the locally weighted scatterplot smoothing method. (B) Exceptional example of CEBPB motif with its positional impact distribution (upper), TF binding motif logo (middle) and TF–DNA interface (lower; Protein Data Bank ID: 2e42).

