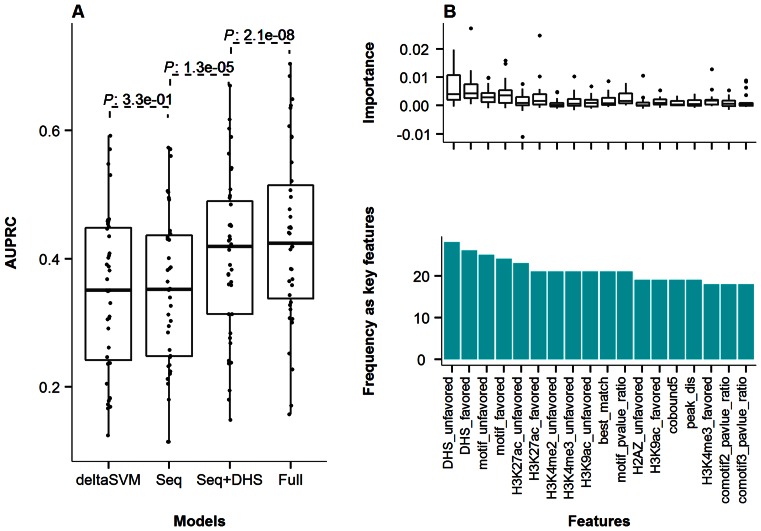
Figure 5.
Performance of ASB classification models and key features. (A) AUPRC of the deltaSVM, Seq, Seq+DHS and Full models across all the investigated TF ChIP-Seq experiments. Seq model was based only on sequence-related features; Seq+DHS model added DHS data on top of the Seq model; and Full model further added histone and cobound TFs. Details on each model and features can be found in Materials and Methods. (B) Top frequent key features in the Full models for all 27 TFs with known motifs. The suffix ‘favor’ and ‘unfavor’ referred to the favored and unfavored alleles at heterozygous sites. The ‘motif_pvalue_ratio’ was the log ratio between two alleles in terms of motif score P-value. The ‘peak_dis’ indicated the distance of the SNV to ChIP-Seq peak maximum position where the highest number of reads were mapped within the peak.

