Figure 5.
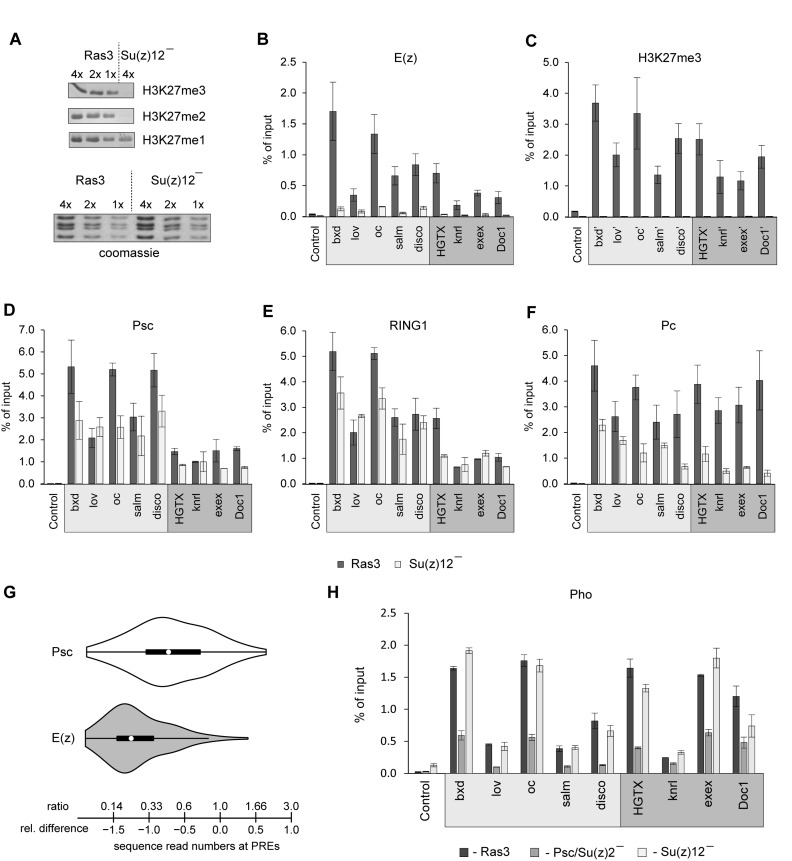
H3K27me3 is not essential for PRC1 binding to PREs. (A) Indicated amounts of histones acid-extracted from Ras3 and Su(z)12 minus cells were analyzed by Western-blot with antibodies against H3K27 methylated to various degrees. Coomassie staining (below) was used to control the loading. (B–F) ChIP-qPCR analyses of PcG proteins and H3K27me3 at PRC2:PRC1 dependent (light grey box) and PRC2:PRC1 independent (dark grey box) PREs in control Ras3 cells and PRC2 deficient Su(z)12 minus cells. (G) Comparison of violin plots of the changes in the number of E(z) ChIP-seq reads at PREs between Psc/Su(z)2 deficient and Ras3 control cells (grey plot) and Psc ChIP-seq reads between Su(z)12 minus and Ras3 control cells (white plot). Violin plots combine box plots with observation density plots. The black boxplots span the inter-quartile range. The whiskers indicate the adjacent values plus or minus 1.5 time inter-quartile range. The white circles mark positions of the medians. The scale indicates the changes in sequence read numbers expressed as relative differences (below) or ratios (above). The E(z) violin plot is skewed to the left and has long right tail, which indicates that the majority of the PREs lose the signal when PRC1 is absent but there is a class of PREs that shows little change. In contrast, the violin plot for Psc is symmetrical and shows no evidence for the two classes of PREs with different dependence on PRC2. These observations are robust as we obtained essentially the same results using a PRE set defined from genomic binding profiles of Psc, Pc and E(z) in Ras3 cells (Supplementary Figure S8, Supplementary Table S5). (H) ChIP-qPCR analyses of the Pho protein at PRC2:PRC1 dependent (light grey box) and PRC2:PRC1 independent (dark grey box) PREs in control (Ras3), Psc/Su(z)2 and Su(z)12 deficient cells.

