Figure 2.
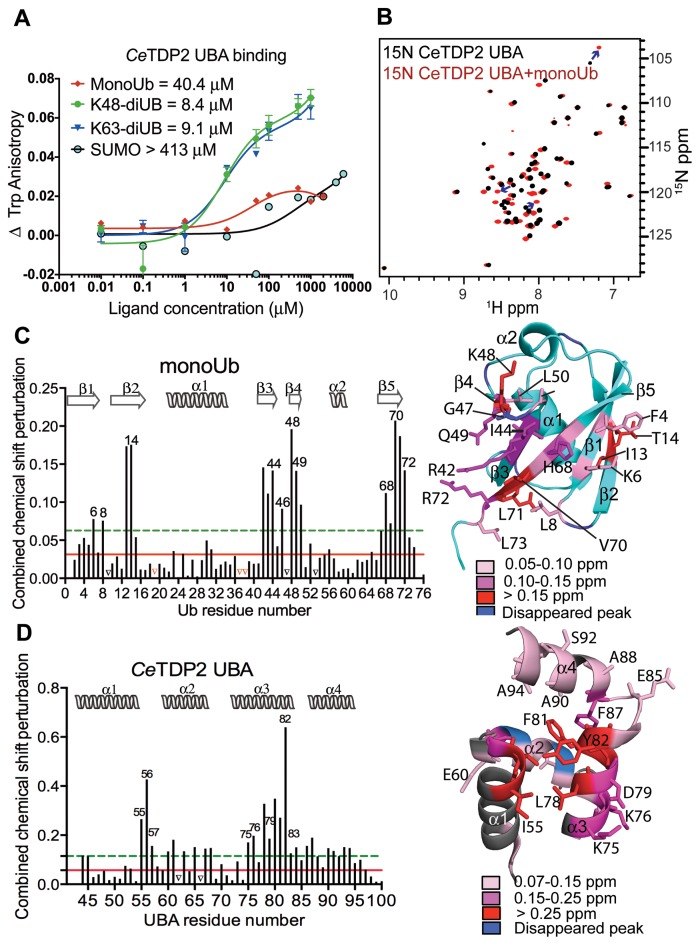
TDP2 UBA binds specifically to ubiquitin. (A) Binding isotherms of TDP2 UBA titrated with increasing concentrations of monoUb, diUb (K48 or K63-linked) and SUMO, monitored by fluorescence anisotropy of Trp72 of TDP2 UBA. (B) HSQC spectrum of 15N labeled CeTDP2 UBA (black), superimposed over that of 15N CeTDP2 UBA in the presence of 6-fold molar excess of monoUb (red). Blue arrows trace a few of the significantly shifted peaks from their free to the bound position. (C) Per residue chemical shift perturbation map of monoUb on the left and residues with significant change (>2 σ0 corr) highlighted on the structure of monoUb on the right (PDB ID: 1D3Z). The solid red and dashed green lines cross the map at 1 and 2 σ0 corr (corrected standard deviation (44,67)), respectively. Peaks that vanished due to significant broadening during the titration are marked by black triangles on the graph. Red triangles on the graph represent the three proline residues that do not show NH peaks in the 2D 1H,15N HSQC experiment and were therefore excluded from the CSP analysis. Secondary structure elements of Ub are drawn on top of the graph. (D) Per residue chemical shift perturbation map of TDP2 UBA on the left and residues with significant change (>2 σ0 corr) highlighted on the structure of TDP2 UBA on the right. Red and green lines as well as black triangles are drawn as in panel C. Secondary structure elements of TDP2 UBA are drawn on top of the graph.

