Figure 7.
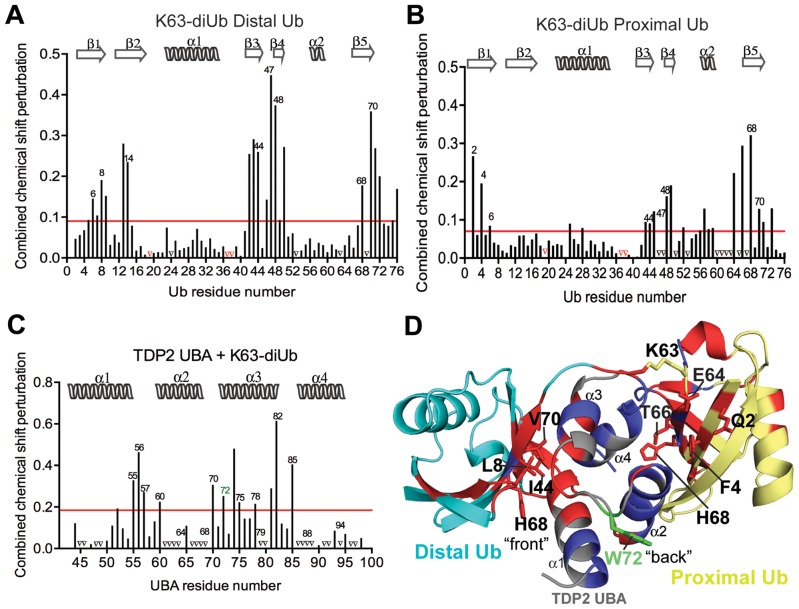
Interaction of K63-linked diUb with UBA. (A) Per residue chemical shift perturbation map of 15N labeled distal Ub residues when K63-linked diUb was titrated with increasing concentrations of CeTDP2 UBA. The red line denotes the cut-off for significance; set at 1 standard deviation (1 σ) from all the weighted averaged chemical shift values. Peaks that vanished during the titration are represented by black triangles on the graph. (B) Per residue chemical shift perturbation map of 15N labeled proximal Ub residues when K63-linked diUb was titrated with increasing concentrations of CeTDP2 UBA. Significance as in A. (C) Per residue chemical shift perturbation map of 15N labeled CeTDP2 UBA residues when it was titrated with increasing concentrations of K63-linked diUb. Significance as in A. (D) A hypothetical model of one molecule of TDP2 UBA binding to one molecule of K63-linked diUb. Significantly shifted residues for TDP2 UBA and Ub are colored in red with some of these residues that determine the UBA interaction surface on each Ub moiety labeled. Peaks that disappeared upon titration are colored in blue on both UBA and Ub moieties.

