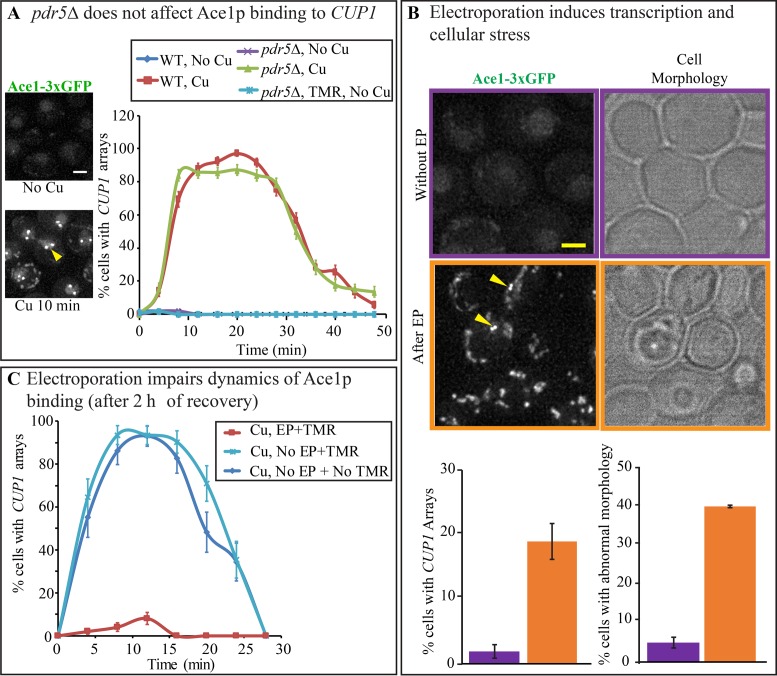
Figure 3.
Disruption of PDR5 does not alter the normal physiology of the cell in contrast to electroporation. (A) Dynamics of Ace1p-3xGFP occupancy on CUP1 array were assayed by counting the number of cells with visible CUP1 arrays observed over time with 4-min time intervals in PDR5 Ace1p-3xGFP (YTK1479), and pdr5Δ Ace1p-3xGFP (YTK1404). N > 100. Error bars represent standard error of the proportion (s.e.p). Arrows point to visible arrays in the representative diploid nucleus of PDR5 Ace1p-3xGFP. Scale bar = 2 μm. (B) PDR5 Ace1p-3xGFP (YTK1479) cells were observed on DeltaVision Elite microscope before and 5 min after electroporation (EP). Error bars represent the standard error of the mean (s.e.m.). Scale bar = 2 μm. (C) PDR5 Ace1p-3xGFP (YTK1479) were allowed to recover for 2 h before being treated with 100 μM CuSO4 to observe dynamics of Ace1p binding to the CUP1 promoters. Cells treated with TMR by electroporation (EP+TMR) were compared with Non-electroporated cells (No EP), treated and not treated with TMR. Error bars represent s.e.p. N ranges from 29 to 100.

