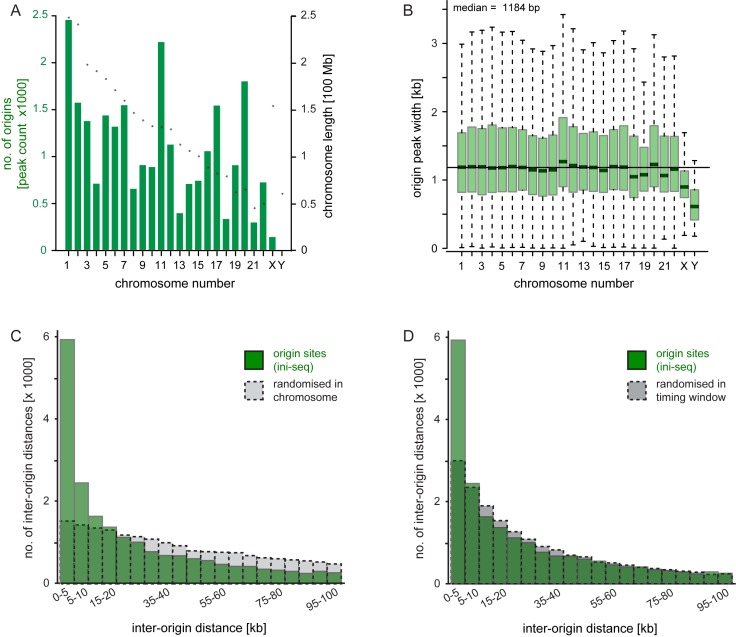
Figure 4.
Genome-wide analysis of DNA replication origin distributions. Enrichment peaks of immunoprecipitated nascent DNA (origin peaks) were called by SICER, excluding the input DNA library. Only peaks present in both libraries IP-A and IP-B (i.e. the intersect) are subsequently analysed. (A) Distribution plot of origin peak counts for each individual human chromosome. Individual chromosome lengths are indicated by asterisks. (B) Distributions of origin peak widths for each human chromosome. Box and whisker plots are shown without individual outliers, whiskers represent 1.5 times the interquartile range above the upper quartile and below the lower quartile, and the overall genomic median is indicated. (C and D) Origin spacing. Inter-origin distances were calculated in 5 kb intervals for the distributions of activated replication origins (green) and control sites (dashed grey) that were randomised either (C) within each chromosome, or (D) within DNA replication timing windows (46).

