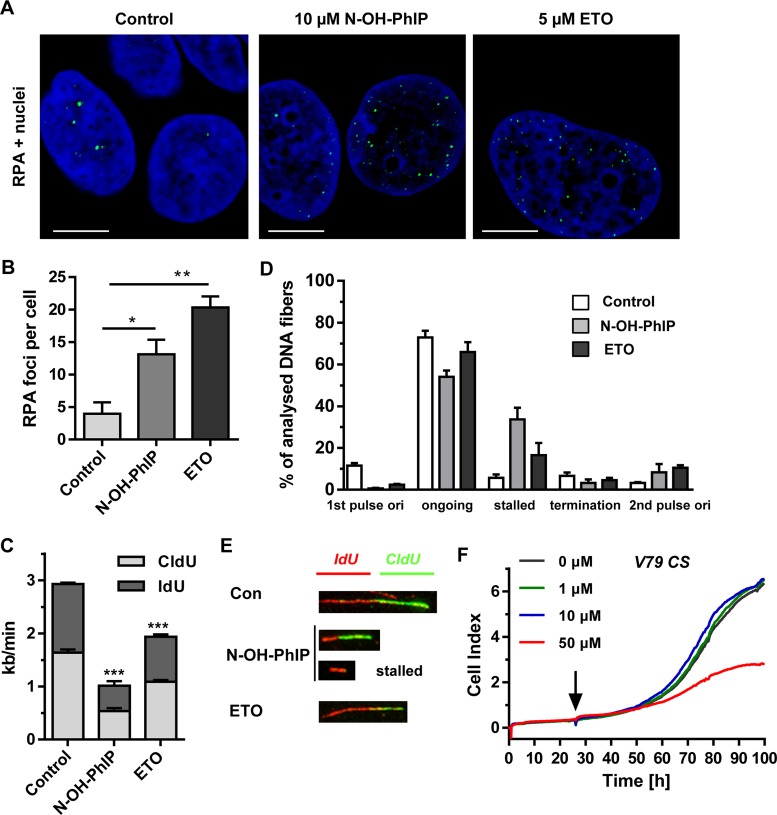
Figure 3.
N-OH-PhIP induces replication stress. (A) Detection of RPA foci. Caco-2 cells were treated as indicated for 14 h, stained with a RPA antibody and subjected to confocal microscopy. Representative images are shown. RPA is depicted in green and nuclei are blue. The scale bar represents 10 μm. (B) Quantitative evaluation of RPA foci in Caco-2 cells shown in (B). The number of RPA foci per nucleus were determined by ImageJ software and evaluated with GraphPad Prism 5.0 (> 100 cells per experiment; n = 3); **P<0.01, *P<0.05 versus control. (C) Impact of N-OH-PhIP on average replication fork speed. Cells were treated for 14 h as described and replication speed was determined by DNA fiber assay followed by confocal microscopy (n = 3); ***P < 0.001 versus control. (D) Distribution of replication structures assessed by the DNA fiber assay in Caco-2 cells exposed to N-OH-PhIP or ETO for 14 h. (E) Representative DNA fiber tracks showing ongoing replication (red-green) and stalled forks (red). (F) Impact of PhIP on the proliferation of V79 CS cells. After 24 h, cells were treated with increasing doses of PhIP (black arrow) and growth was monitored by an impedance-based analysis over the following 72 h.

