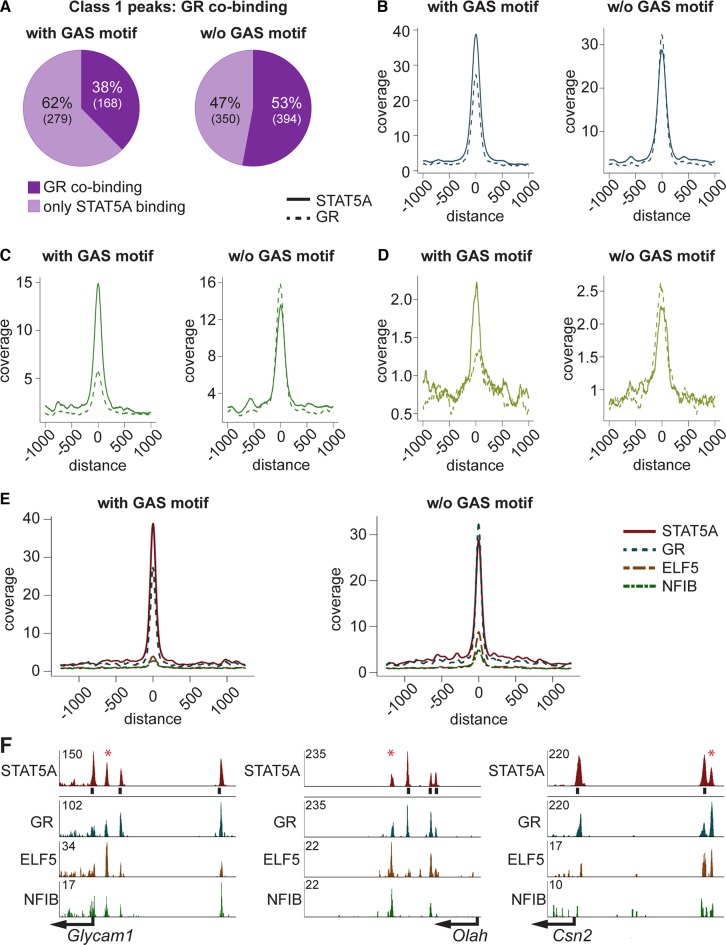
Figure 3.
(A) Class 1 STAT5A enhancers were separated into enhancers with and without GAS motif. Thirty-eight percent of the enhancers with, and 53% without, a GAS motif co-bound GR. (B) STAT5 enhancers were higher in the presence of GAS motifs. Coverage of GR was independent of the GAS motif status. (C) Preferential reduction of class 1 enhancers containing a GAS motif occurred at 12 h of involution (I12). GR coverage at enhancers with GAS motifs is less than 45% of that obtained at enhancers lacking a GAS motif. At sites without GAS motif GR enhancers continue to exceed STAT5A enhancers. (D) Peak coverage at 24 h of involution (I24). At this time point most enhancers have been decommissioned but the pattern is reminiscent to that seen at I12. (E) Peak coverage of STAT5A class 1 enhancers with and without GAS motifs and GR, ELF5 and NFIB co-binding. Enhancers without GAS motif showed stronger co-binding of GR, ELF5 and NFIB as compared to those with a GAS motif. (F) Three representative genes and their STAT5A enhancers illustrate co-binding. Glycam1, GR co-bound at all STAT5A enhancers. Strongest ELF5 binding was at the enhancer lacking a GAS motif (asterix). The STAT5A enhancer without GAS motif at Olah showed the strongest ELF5 and NFIB co-binding. All STAT5A enhancers co-bound GR. Csn2 had also one STAT5A enhancer without GAS motif, which had the strongest co-binding by GR and ELF5.

